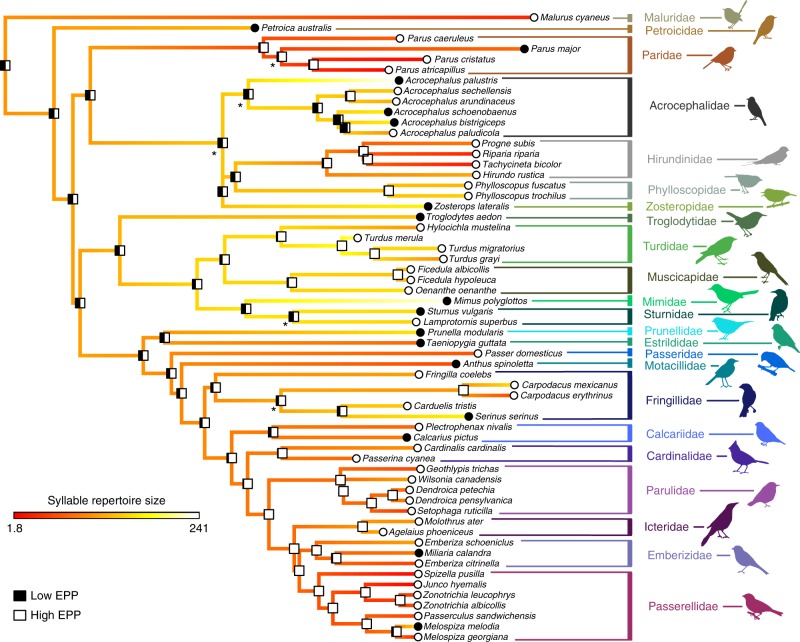
Fig. 3.
Ancestral character estimation of extra-pair paternity and syllable repertoire. At the tips of the tree, low (<10%) EPP is indicated by black circles and high EPP is indicated by white circles. At the nodes of the tree, bars indicate the results of an ancestral character estimation algorithm, with the black fraction of the bar indicating the percent likelihood that the ancestor at that node had low EPP. As in Fig. 2, the colors from red to white along the branches of the tree indicate the estimated ancestral syllable repertoire size. Asterisks indicate nodes that had less than 70% support across 1000 tree replicates; no node had less than 50% support on this tree. The syllable repertoire sizes ranged from 1.8 to 241 in these species and were log10 transformed for analysis. We found that species with high EPP had significantly smaller syllable repertoires than species with low EPP when controlling for phylogeny (PhylANOVA p = 0.001). Images representing taxa were used or modified from PhyloPic (http://phylopic.org). Several images are used under Creative Commons licenses, with changes made where indicated: Sturnidae (credit to Maxime Dahirel, http://creativecommons.org/licenses/by/3.0/), Estrildidae (credit to Jim Bendon for photography and T. Michael Keesey for vectorization, https://creativecommons.org/licenses/by-sa/3.0/), Fringillidae (credit to Francesco Veronesi (vectorized by T. Michael Keesey), https://creativecommons.org/licenses/by-nc-sa/3.0/), Emberizidae (credit to L. Shyamal, https://creativecommons.org/licenses/by-sa/3.0/; this image was also adapted for Parulidae), and Mimidae and Motacillidae (credit to Michelle Site, https://creativecommons.org/licenses/by-nc/3.0/, both adapted from the original image)

