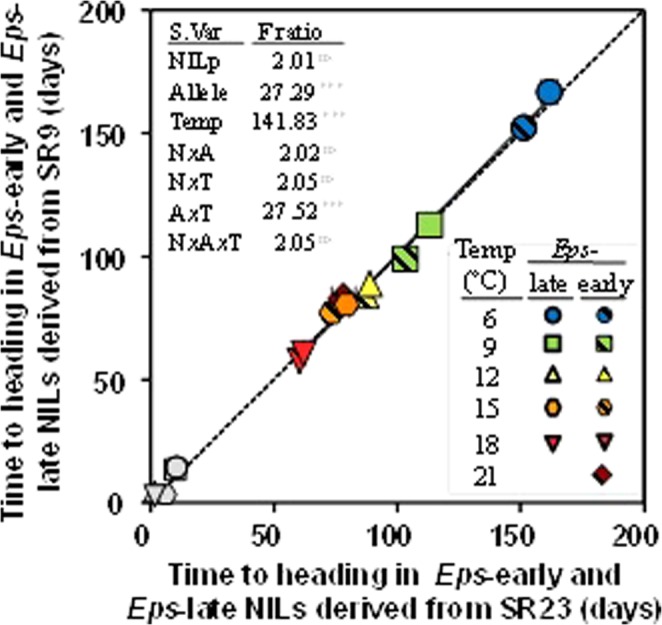
Figure 2.

Time from the initiation of the experiment to heading for the NILs carrying the same Eps alleles in each of the two NIL pairs (NILs derived from either SR9 or SR23, see Materials and Methods) under the temperature regimes in which heading was reached. Dashed line is the 1:1 relationship. Solid line fitted by linear regression (R2 = 0.993, P < 0.001). Grey smaller data-points (bottom left corner) stand for the differences in time to heading between lines with the Eps-late or -early alleles (i.e. the delay produced by the Eps-late respect to its Eps-early counterpart); which are not considered in the regression. Inset are the F-ratio values of the main factors and their interactions (*** and ns indicates that the F-ratio was significant, P < 0.001, and not significant, respectively). Segments on each symbol stand for the SEs (if not seen is because the magnitude was smaller than the size of the symbol).
