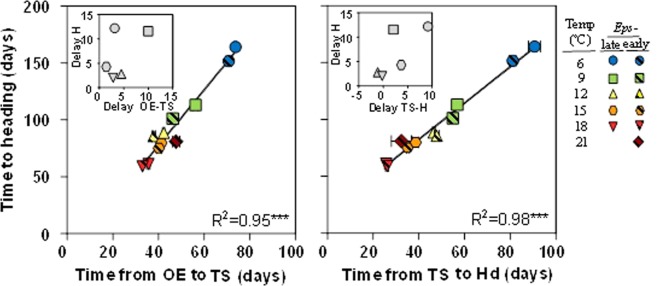
Figure 5.
Relationship between time to heading and either the period from the onset of the experiment (OE) to terminal spikelet (TS) (left panel) or the late reproductive phase from TS to heading (Hd) (right panel) for lines carrying Eps-early (hatched symbols) or Eps-late (solid symbols) alleles grown under constant temperatures of 6, 9, 12, 15, 18 and 21 °C. Lines fitted by linear regression (*P < 0.001). Inset each panel is a detail of the delay produced by the Eps-late allele (difference between lines with the Eps-late or Eps-early alleles) in time to heading respect to the delay in the component phases considered in the study.

