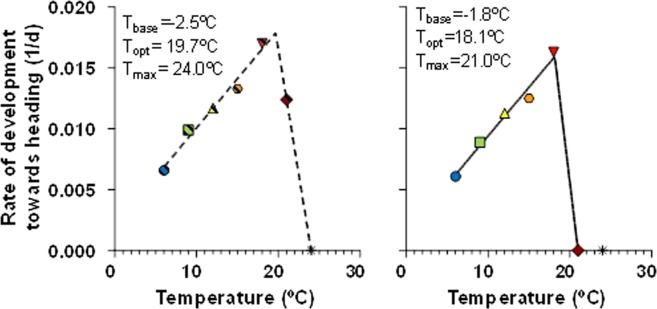
Figure 6.
Relationship between the rate of development between the onset of the experiment and heading and temperature for lines carrying Eps-early (left panel) or Eps-late (right panel) alleles grown under constant temperatures of 6, 9, 12, 15, 18, 21 and 24 °C. To avoid a biased estimate of parameters, lines were fitted by bi-linear regression fitted with data at temperatures between the base and the maximum thresholds (for lines carrying Eps-early 6–24 °C and for Eps-late 6–21 °C). Insets are the calculated cardinal temperatures (base, Tbase; optimum, Topt; and maximum, Tmax) for each group of NILs.

