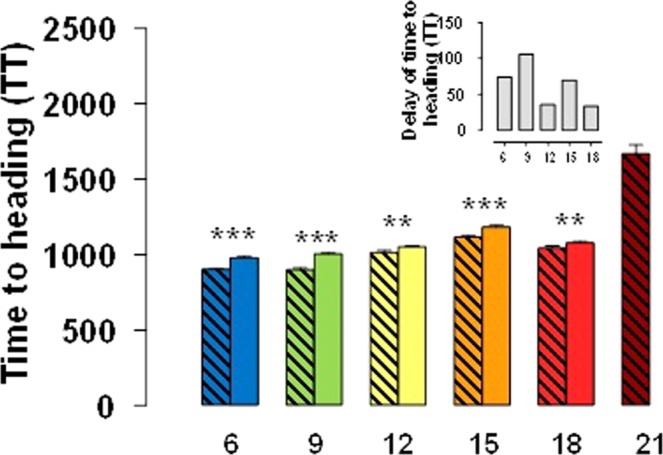
Figure 8.

Thermal time from the onset of the experiment to heading (estimated using 0 °C as base temperature) for lines carrying Eps- early (hatched bars) or Eps-late (solid bars) alleles grown under constant temperatures of 6, 9, 12, 15, 18, and 21 °C. Inset is a detail of the difference (in °C d) between lines with the Eps-late or Eps-early alleles. Asterisks indicate the statistical significance of the differences between lines with late and early alleles at each temperature from the LSmeans contrast (**P < 0.01, ***P < 0.001).
