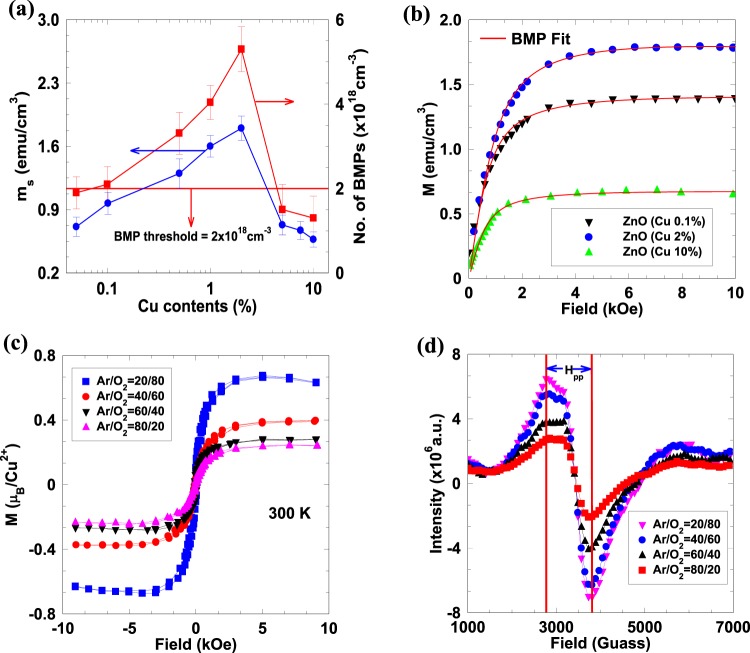
Figure 2.
(a) Variation of saturated magnetic moment per cm3 and bound magnetic polarons concentration at various Cu doping from 0.05% to 10%. Connecting lines are guide for eyes. Horizontal line indicates the percolation threshold for bound magnetic polarons in the hexagonal wurtzite ZnO. (b) M–H curve fitted with BMP model. Symbols are for experimental data and the solid red line is a fit with BMP model. (c) Magnetization curves and (d) EPR spectra of 2% Cu-doped ZnO films grown at different Ar/O2 ratio.

