Fig. 4.
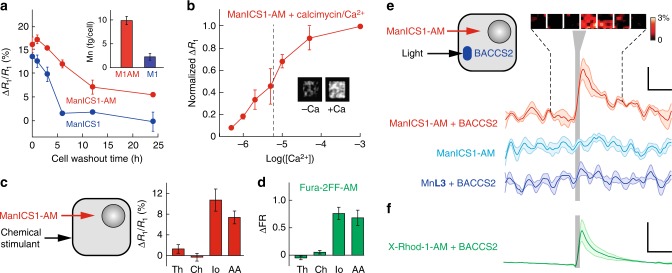
ManICS1 reports calcium-dependent MRI signal changes in cells. a Washout time course of ΔR1/R1 vs. time for HEK293 cells preincubated with 10 µM ManICS1-AM (red) or ManICS1 acid form (blue). Elemental analysis of cytosolic fractions from incubated cell lysates (inset) indicates intracellular manganese accumulation in ManICS1-AM (M1AM)-treated cells but not ManICS1 (M1)-treated cells. b Titration of extracellular calcium concentration equilibrated in the presence of 10 µM of the Ca2+ ionophore calcimycin in ManICS1-AM-loaded cells. A midpoint of calcium-induced changes occurs at [Ca2+] = 5 µM. Inset compares MRI scans of cell pellets imaged in the absence (left) vs. presence (right) of 1 mM calcium. c Calcium responses measured from HEK293 cells labeled with ManICS1-AM and treated by extracellular addition of chemical stimulants (left). Significant R1 changes are observed in response to ionomycin (Io) and arachidonic acid (AA) (p ≤ 0.001), but not thapsigargin (Th) or carbachol (Ch) (p ≥ 0.2). d Responses measured by fluorescence spectroscopy from cells loaded with the fluorescent calcium indicator Fura-2FF-AM under stimulation conditions as in c. e Cells were loaded by incubation with 40 µM ManICS1-AM, transfected with the light sensitive Orai calcium channel activator BACCS2, and stimulated with 480 nm light (diagram at left). The red time course shows resulting changes in T1-weighted signal as a function of time, before, during, and after stimulation (vertical gray bar). Inset at top depicts image snapshots binned over successive 240 s windows during the time series portion indicated by dashed lines and indicating percent signal changes observed at a voxel level. Stimulus-dependent signal changes were not observed in analogous experiments performed using cells lacking BACCS2 (cyan) or cells labeled with MnL3 instead of ManICS1-AM (blue). f Fluorescence time course observed from BACCS2-expressing cells incubated with 5 µM X-Rhod-1-AM and stimulated as in panel e. Scale bars: horizontal = 300 s, vertical in e = 0.3%, f = 20%. Error bars represent SEMs of a three, b three, c six, and d six independent measurements. Shading in e and f represents SEM from five measurements

