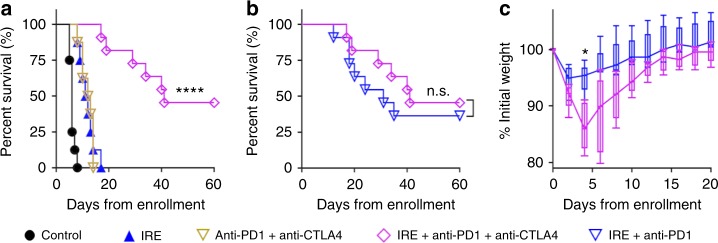
Fig. 2.
Survival of KRAS* model treated with IRE, anti-CTLA4, and/or anti-PD1. a Kaplan–Meier survival curves of mice in sham control (black solid circle, n = 8), anti-CTLA4 + anti-PD1 (brown triangle, n = 8), IRE only (blue solid triangle, n = 8), and IRE + anti-CTLA4 + anti-PD1 groups (magenta diamond, n = 11). ****p < 0.0001, log-rank test. b Survival of IRE + anti-CTLA4 + anti-PD1 (n = 11) and IRE + anti-PD1 (blue triangle, n = 11) groups, n.s. not significant, log-rank test. c Relative change in mouse body weight after treatment with IRE + anti-CTLA4 + anti-PD1 or IRE + anti-PD1 (n = 5 each group). Data presented as interquartile range (IQR) with a median center line and min to max error bars, *p < 0.05, double-sided Student’s t-test. Source data are provided as a Source Data file

