Fig. 9.
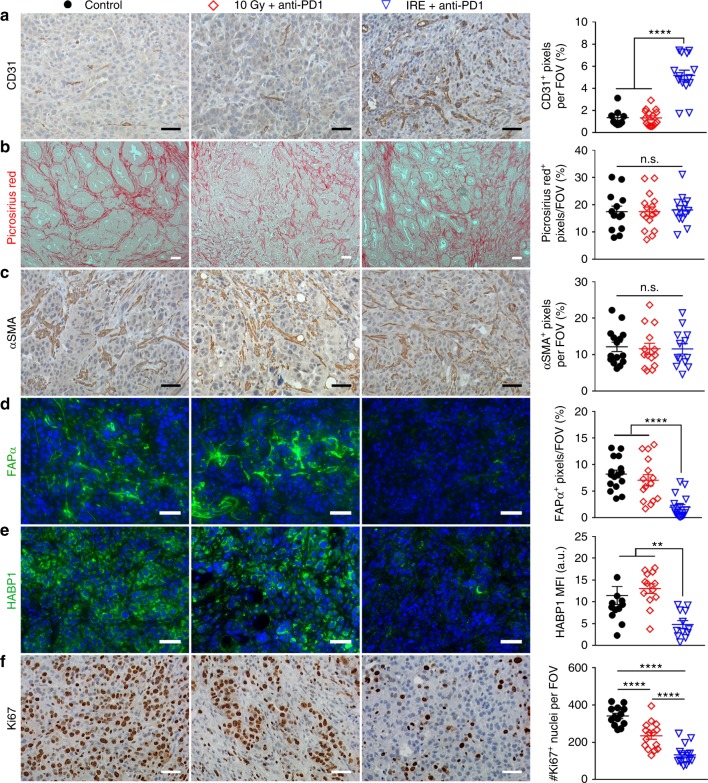
IHC staining of viable tumor after 10 Gy + anti-PD1 or IRE + anti-PD1. Representative micrographs of staining for CD31 (a), Picrosirius Red (b), αSMA (c), FAPα (d), HABP1 (e), and Ki67 (f) in control (black solid circle), 10 Gy + anti-PD1 (red diamond), and IRE + anti-PD1 (blue triangle) groups, and corresponding quantifications. Ten to fifteen visual fields were randomly captured. Scale bars = 50 µm. Five doses of anti-PD1 had been administered at this time point for the 10 Gy + anti-PD1 and IRE + anti-PD1 groups. Data are presented as mean ± SEM. Significance was determined using 1-way ANOVA followed by Tukey post hoc analysis. *p < 0.05, **p < 0.01, ***p < 0.001, ****p < 0.0001. MFI mean fluorescence intensity, FOV field of view, n.s. not significant. Source data are provided as a Source Data file

