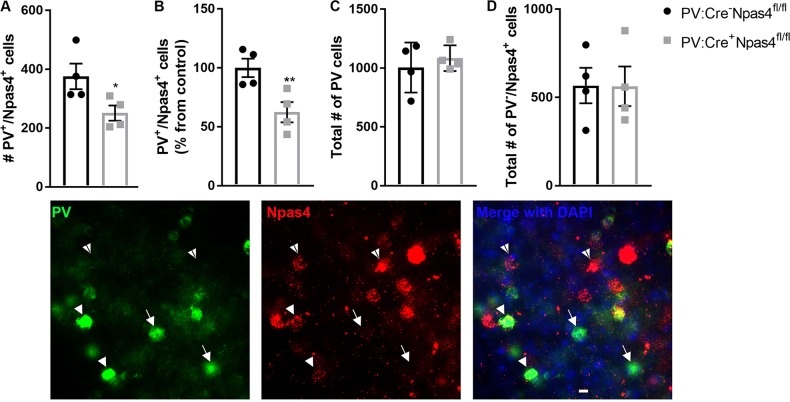
Fig. 3. Verification of downregulation of Npas4 in PV+ neurons in the PFC of PV:Cre+Npas4fl/fl.
Double immunofluorescence staining for PV and Npas4 was assessed with an unbiased stereological quantitative analysis. a The number of PV+ neurons expressing Npas4 was significantly lower in PV:Cre+Npas4fl/fl than their respective controls (PV:Cre−Npas4fl/fl—unpaired t-test: t6 = 2.467; p = 0.024). b This corresponds to a decrease in expression of 38% vs. controls (t6 = 3.239; p = 0.008). c The total number of PV+ neurons and (d) the number of Npas4-expressing cells that are not PV+ neurons were not different between the two groups of mice (p > 0.05). The photomicrographs are representative pictures of immunofluorescence staining for PV (green), Npas4 (red), and DAPI (blue). Full white arrow heads point to a double-stained cell (PV+ neurons expressing Npas4), arrows point toward PV+ neurons not expressing Npas4, and white arrowheads with black stripe point toward Npas4-expressing cells that are not PV+ neurons. *p ≤ 0.05; **p < 0.01; n = 3 PFC sections from four mice per genotype

