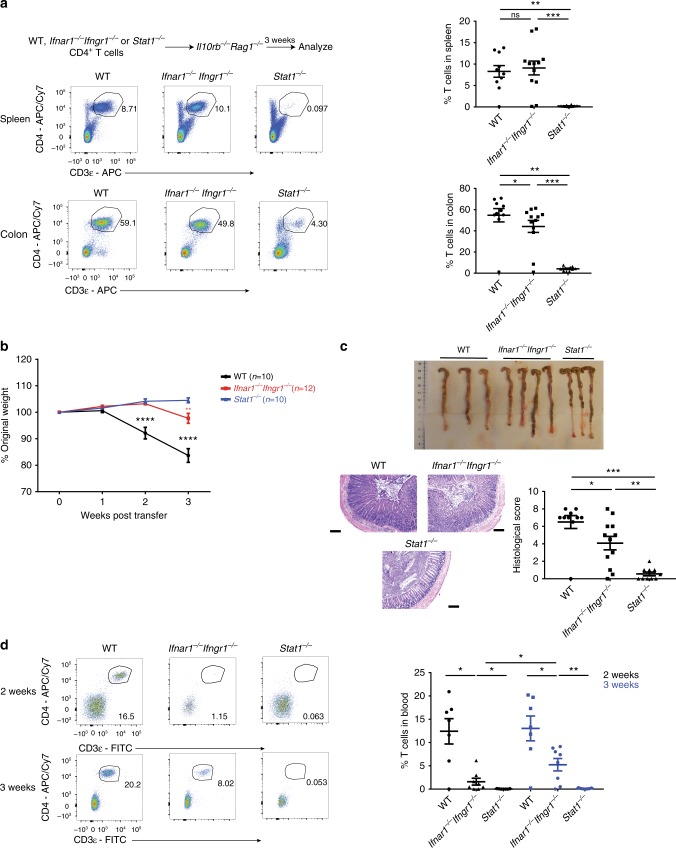
Fig. 3.
Type I + II IFN signaling do not explain the defective expansion of Stat1−/− T cells. Il10rb−/−Rag1−/− mice were injected i.p. with 1 × 10⁶ WT, Ifnar1−/−Ifngr1−/− or Stat1−/− CD4+ T cells. a Representative flow cytometry plots of CD4+ T cells (gated on live CD45+ cells, Supplementary Fig. 4b) in the spleen and colon followed by their mean frequencies ± SEM at 3 weeks post transfer. b Mean % initial body weights ± SEM following T-cell transfer. Source data are provided as a Source Data file. c Representative images of colons, as well as representative H&E images of distal colon sections with mean histological scores ± SEM at 3 weeks post transfer. Scale bar represents 200 µm. d Representative flow cytometry plots of CD4+ T cells (gated on CD45+ cells) in the blood followed by their mean frequencies ± SEM at 2 and 3 weeks post transfer. All data are pooled from two to three independent experiments, with each point representing an individual mouse. *p < 0.05, **p < 0.01, ***p < 0.001, ****p < 0.0001 by b two-way ANOVA with Bonferroni’s correction (WT compared to Ifnar1−/− Ifngr1−/− or Stat1−/−, Ifnar1−/− Ifngr1−/− compared to Stat1−/−) or by a, c, d two-tailed Mann–Whitney test

