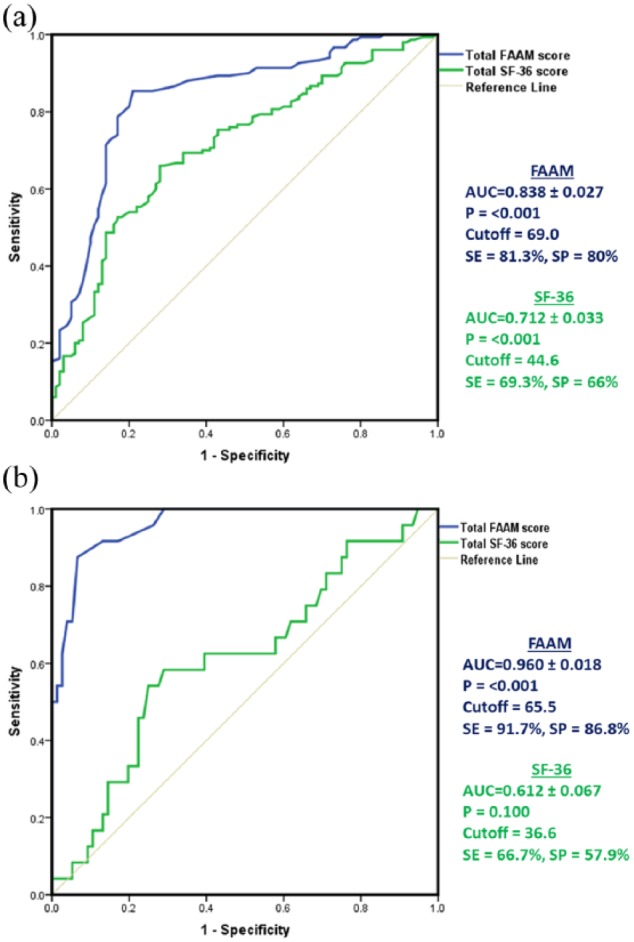
Figure 2.

Discriminating values of FAAM and SF-36 questionnaires. ROC curve analysis of total scores of FAAM and SF-36 were employed to (a) discrimination of T2DM patients and patients with diabetic foot disease and (b) discrimination of T2DM patients with complete healing of DF ulcers and with unhealed ones.
AUC: area under the curve; SE: sensitivity; SP: specificity; SF-36: 36-item short-form questionnaire; FAAM: foot and ankle ability measure.
