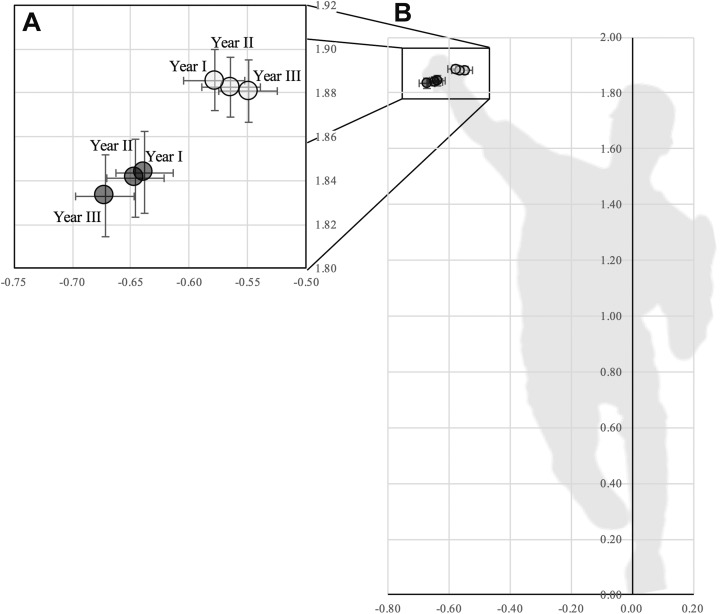
Figure 2.
Pitch release location (measured in meters from the center of the mound) as viewed from home plate, with error bars indicating SEM. Negative numbers on the horizontal axis indicate a more lateral release. The ulnar collateral ligament reconstruction cohort is shown in dark gray, with the most lateral data point indicating preinjury year 3. The control cohort is shown in light gray, with the most medial data point indicating preindex year 3. (A) A closer view of (B) the main graph is labeled with corresponding data year.

