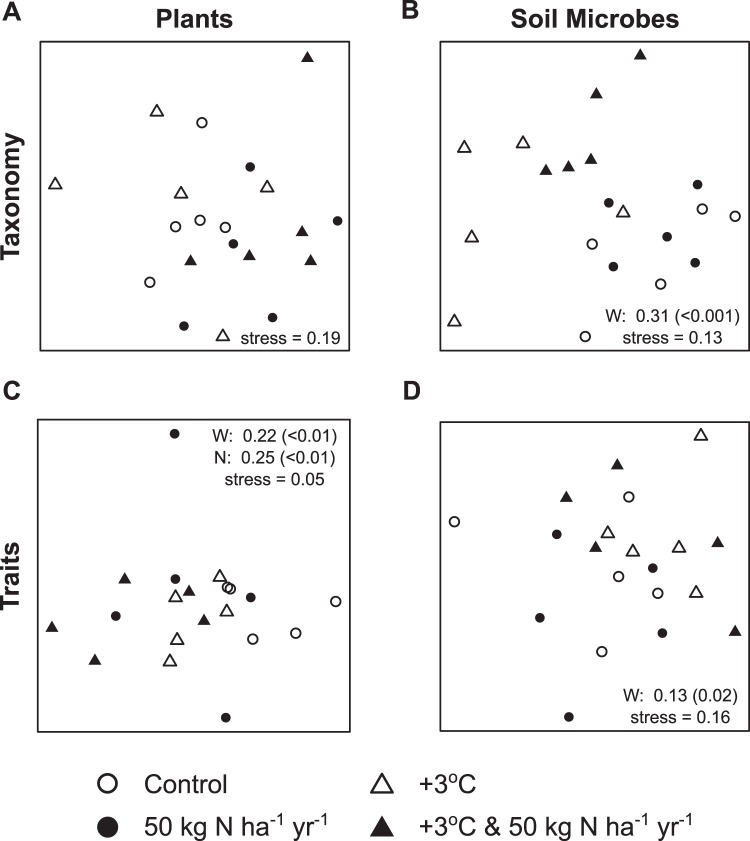
Figure 1.
Plant and soil microbial community composition responses to global change drivers. Non-metric multidimensional scaling (NMDS) ordinations of experimental plots based on Bray-Curtis dissimilarities calculated from: (A) percent cover of colonizing plant species, (B) relative abundance of bacterial phyla, (C) community weighted mean trait values of the colonizing plant species, and (D) relative abundance of the broadest level of subsystems of microbial protein-coding genes. Significant results (p < 0.05) from permutational multivariate analysis of variance (permanova) tests for the same datasets are listed. Partial R2 values are given with p-values listed in parentheses for those results with p < 0.05 (W: warming, N: nitrogen addition, N × W: nitrogen and warming). Complete permanova results are given in Table S3. See Supplementary Information for equivalent ordinations (Fig. S1) and permanova results (Table S7) for the relative abundance of bacterial genera and the most specific level of bacterial protein-coding genes.

