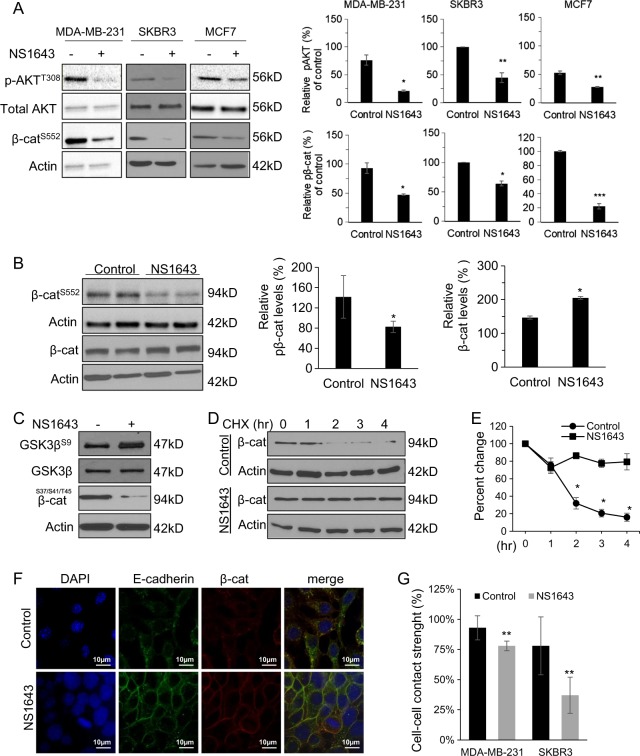
Fig. 6. Kv11.1 controls β-catenin nuclear translocation signaling.
a Representative western blot images of phospho-AKTT308, phospho-β-cateninS552, and total AKT levels in cells or b tumors extracted from mice treated with control or NS1643. Cells were treated with 50 μm of NS1643 for 24 h, harvested, and subjected to western blot analysis. Actin was used as a loading control. Quantification of the levels of phospho-AKT and phospho-β-catenin were done using NIH ImageJ software. c Representative western blot images of phospho-GSK3⍰Ser9 and total GSK3⍰ levels in MDA-MB-231. d Representative western blot images of β-catenin levels in cells treated with cycloheximide alone or NS1643 for the indicated time and e quantification of the effects (n = 3). Quantification of the levels of β-catenin and phospho-β-catenin were done using NIH ImageJ software. f Confocal microscopy images are representing the accumulation of β-catenin at the surface membrane in MDA-MD-231 cells treated with control vehicle or NS1643 for 24 h. g Graph showing the effect of NS1643 on cell–cell contact measured by Dispase assay (n = 6; mean ± SD; *P < 0.05)

