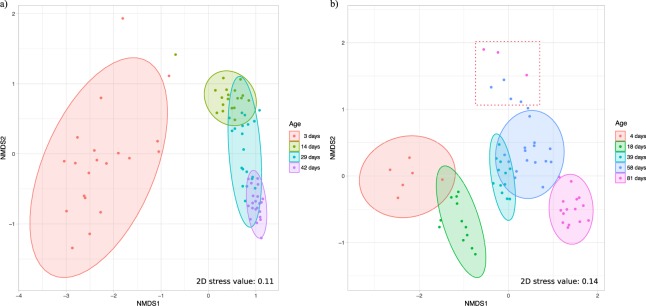
Figure 2.
Non-metric multidimensional scaling (NMDS) plot based on Bray-Curtis dissimilarity matrix on relative abundance data in broilers (a) and free-range chickens (b). Colors indicate age groups. Ellipses indicate 95% confidence intervals of multivariate t-distribution around centroids of the groupings with age as factor. Dots within the square area in plot b represent chickens with typhlitis, which were excluded for the estimation of the ellipses (see text).

