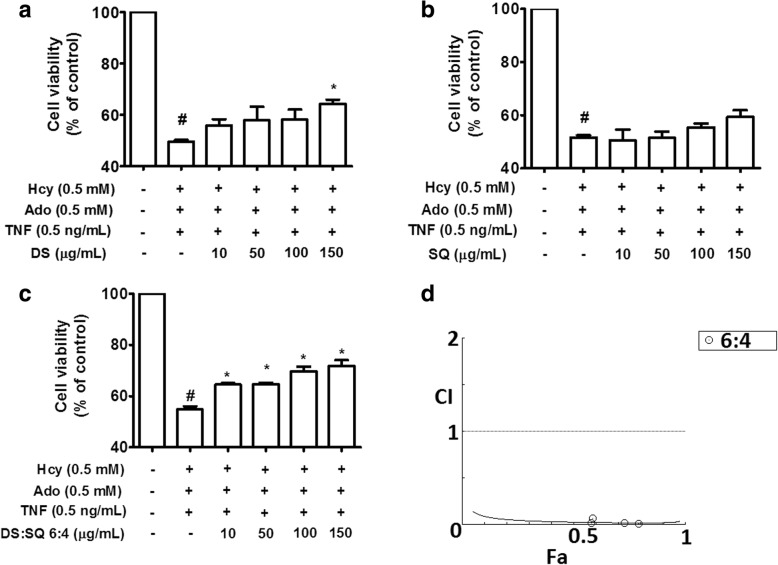
Fig. 1.
The protective effect of DS, SQ and DS-SQ (6:4) on EA.hy926 cells against Hcy-Ado-TNF cytotoxicity was determined by MTT assay. Cell viability, as determined for DS (a), SQ (b) and DS-SQ 6:4 (c) following treatments with Hcy-Ado-TNF in EA.hy926 cells, respectively. Cell viability was expressed as a percentage compared to control. Data shown are mean ± SEM, n > 3. * P < 0.05, ** P < 0.01, *** P < 0.001 in comparison with other combinations in the respective cell lines. d CI values were plotted as a function of fractional of cell viability (Fa) by ‘CompuSyn’ software. Fa values correspond to percentage cell viability relative to control. The solid line is the reference line, where CI value equals 1; solid line represents CI values at different Fa

