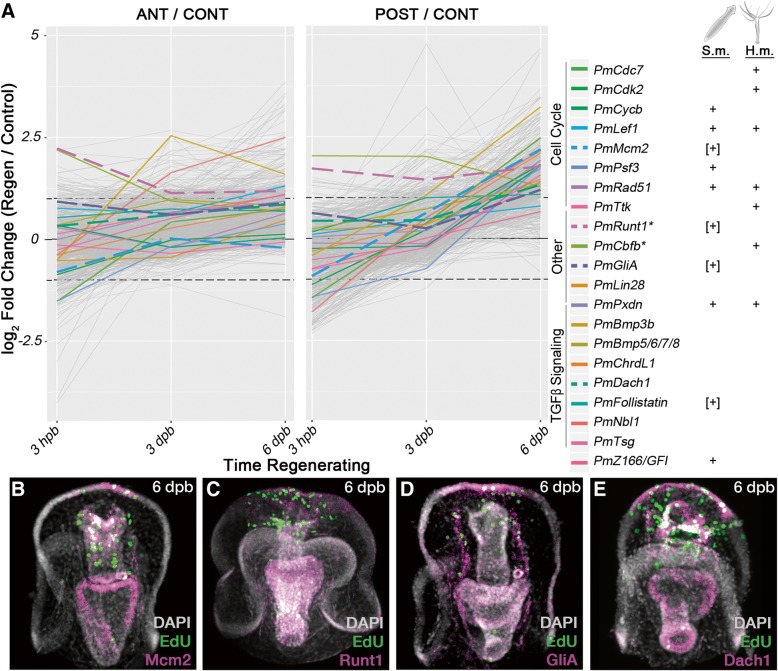
Fig. 8.
Shared proliferation-associated genes. a These data show sea star log fold change values for genes differentially expressed at later stages in regenerating fragments compared with non-bisected sibling control larvae (i.e., sea star cluster V). All genes assigned to cluster V are plotted in gray. Several genes, either referenced in the text or representative of functions considered, are indicated with colored lines. Next to the key for each gene is an indication (i.e., “+”) of whether an ortholog for that gene was found in an analogous cluster in either the planaria (S.m.) or hydra (H.m.) datasets. Indicators in brackets (e.g., “[+]”) are those where no overlapping ortholog was identified by our analyses, but genes with the same name were implicated by published datasets. Genes plotted with dashed lines are shown by fluorescent in situ hybridization (below). Mcm2 (b), Runt1 (c), GliA (d), and Dach1 (e) are all expressed in the anterior aspects of regenerating fragments at 6 dpb. In many cases, the expression of these genes is coincident with an EdU+ cell, suggesting that these genes are expressed, at least in part, in proliferating cells

