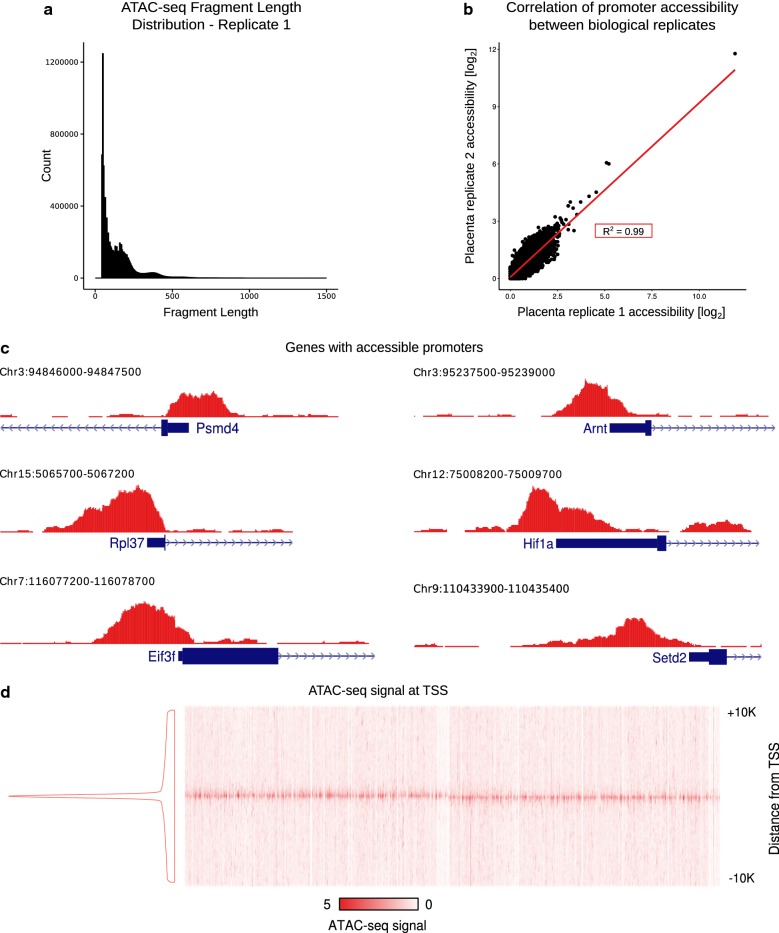
Fig. 1.
ATAC-seq analysis of e9.5 mouse placenta. a Distribution of ATAC-seq data fragment lengths from a representative sample (biological replicate 1). Small fragments correspond to open chromatin while peaks at larger fragment sizes represent fragments that span one or more nucleosomes. b Scatter plot representing promoter accessibility for each gene in replicate 1 plotted against the promoter accessibility for the corresponding gene in replicate 2. Biological replicates show a strong correlation, indicated in the red box (Pearson Correlation Coefficient). c Representative genes with a pileup of ATAC-seq reads in the promoter region. d Heatmap (total number of reads at the start site normalized by library size) and density plot of ATAC-seq fragments showing enrichment at gene TSSs (plot includes all knownGenes from the UCSC genome browser)

