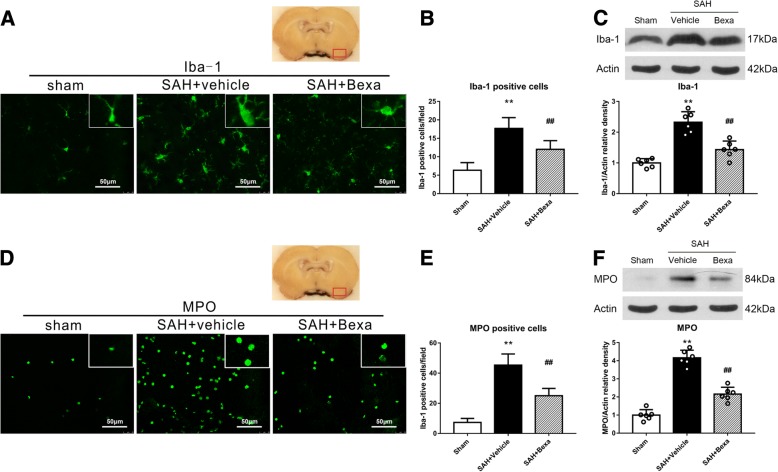
Fig. 4.
The effects of bexarotene on microglia/macrophage activation and neutrophil infiltration at 24 h after SAH. a, d Representative microphotograph of immunofluorescence staining of Iba-1 (green) and MPO (green) at 24 h after SAH. b, e Quantitative analyses of Iba-1- and MPO-positive cells in the basal cortex at 24 h after SAH. **P < 0.01 vs. sham, ##P < 0.01 vs. SAH + vehicle. Error bars were represented as mean ± SD. n = 4 per group. c, f Representative western blot bands and quantitative analyses of Iba-1 and MPO protein levels in the left hemisphere at 24 h after SAH. **P < 0.01 vs. sham, ##P < 0.01 vs. SAH + vehicle. Error bars were represented as mean ± SD. n = 6 per group. Bexa bexarotene

