Fig. 1.

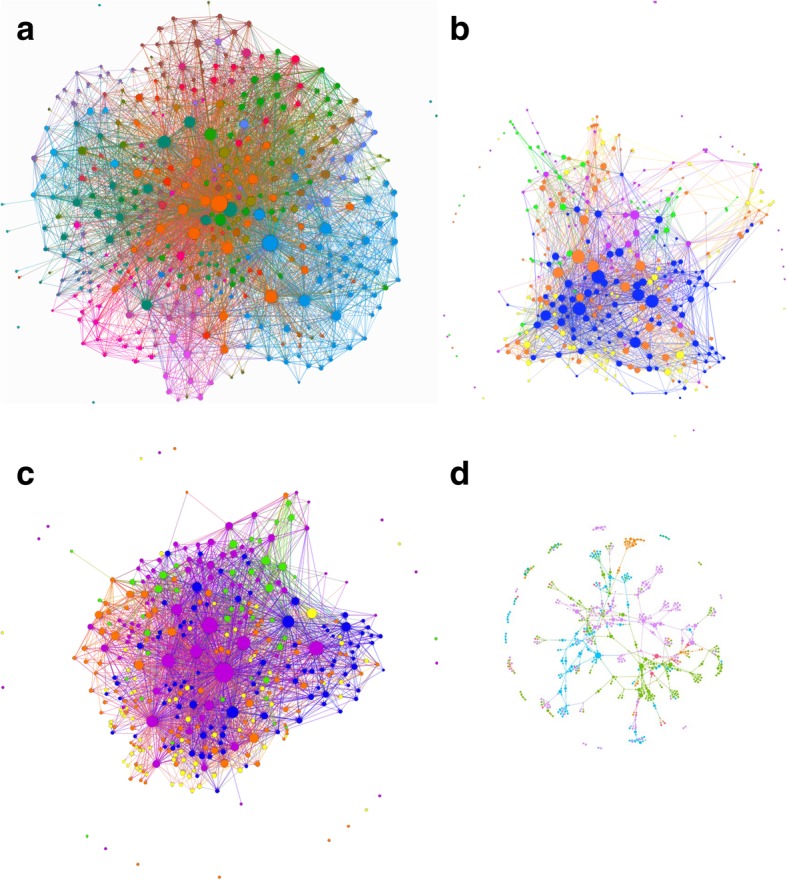
Sociograms. Nodes are Australian Genomic members and size of node is indicative of in-degree (the bigger the node the more highly nominated). a Australian Genomics socio-professional network. Colours show the respondents’ groups (seven groups with the most ties of a total of 38 group). Legend:  Operations,
  KidGen Renal Genetics,
  Acute Care Genomic Testing,
  Genetic Immunology,
  Cardiovascular Genetic Disorders,
  National Steering Committee,
  Acute Lymphoblastic Leukaemia. b Genomic learning community of respondents before Australian Genomics Health Alliance started operation in 2016. Colour of node shows professional qualification of the respondent:
  Medical scientist,
  Genetic specialist,
  Other (e.g. consumer, student, operational staff),
  Medical specialist,
  Researcher. c “Met through Australian Genomics” network: genomic learning community in 2018 after 2 years’ operation of Australian Genomics Health Alliance. Colour of node (see b) shows professional qualification of respondent. d Collaborators from outside Australian Genomics, resident in Australia. Nodes here are respondents to this question and the people they nominated. Colour of node indicated State or Territory of Australia:
  New South Wales,
  Queensland,
  Victoria,
  South Australia,
  Australian Capital Territory,
  Western Australia,
  Tasmania
