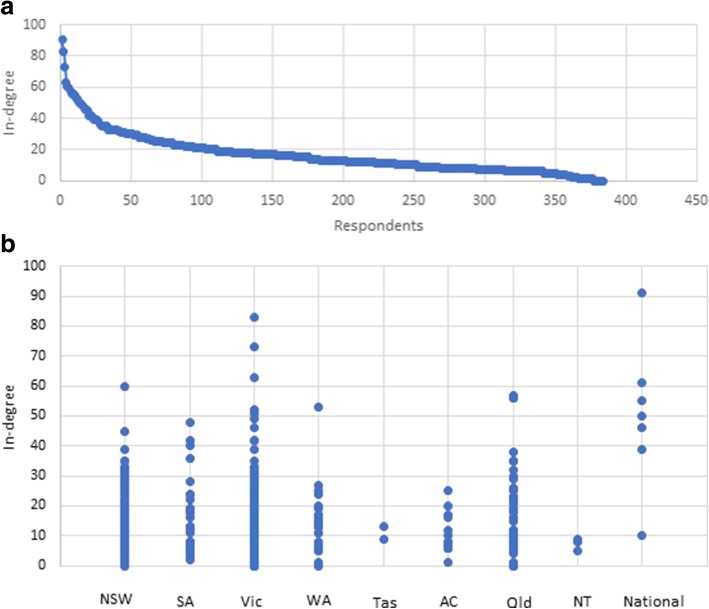
Fig. 2.
a Distribution of in-degree for the Australian Genomic community. In-degree counts the number of ties directed to an actor in the network and is a measure here of influence. b Dot plot showing the distribution of in-degree by State of Australia. (NSW, New South Wales; SA, South Australia; Vic, Victoria; WA, Western Australia; Tas, Tasmania; ACT, Australian Capital Territory; Qld, Queensland; NT, Northern Territory)

