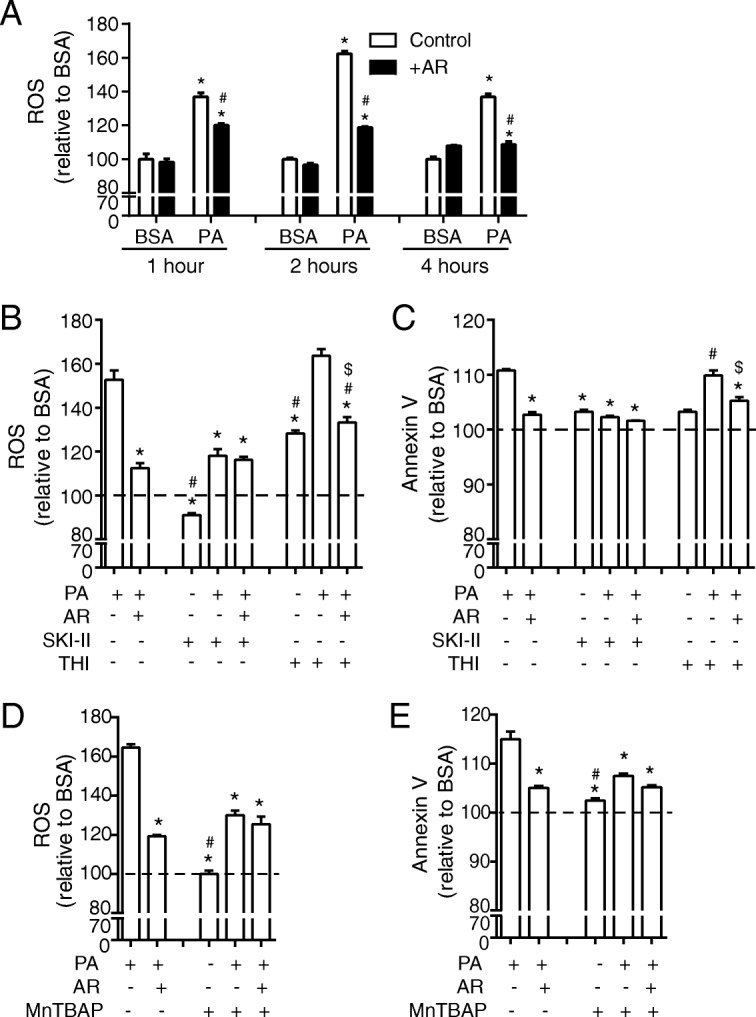
Fig. 3.

Pharmacologic regulation of S1P levels significantly alters ROS production in H9c2 cells treated ± PA. a ROS production in H9c2 cells measured using a DCF-DA assay. Following a preincubation with 0.5% FBS, cells were incubated with 0.1 mM FA for 1, 2, or 4 h or were also treated with the addition of 35 μM AdipoRon (AR) as indicated. Data represent mean ± SEM; *P < 0.05 vs BSA, #P < 0.05 vs PA, n = 6. In a subset of cells in addition to 0.1 mM PA or a BSA vehicle control with or without the addition of 35 μM AR, 5 μM SKI-II and 5 μM THI were added for 4 h following which b) ROS was measured using DCF-DA assay and c) cell death was measured using an Annexin V assay (shown as % toxicity). *P < 0.05 vs PA, #P < 0.05 vs PA + AR, $P < 0.05 vs PA + THI, n = 3. In a subset of cells 100 μM MnTBAP was added for 4 h following which d) ROS was measured using DCF-DA assay and e) cell death was measured using an Annexin V assay (shown as % toxicity). Data represent mean ± SEM; *P < 0.05 vs PA, #P < 0.05 vs PA + AR, n = 3
