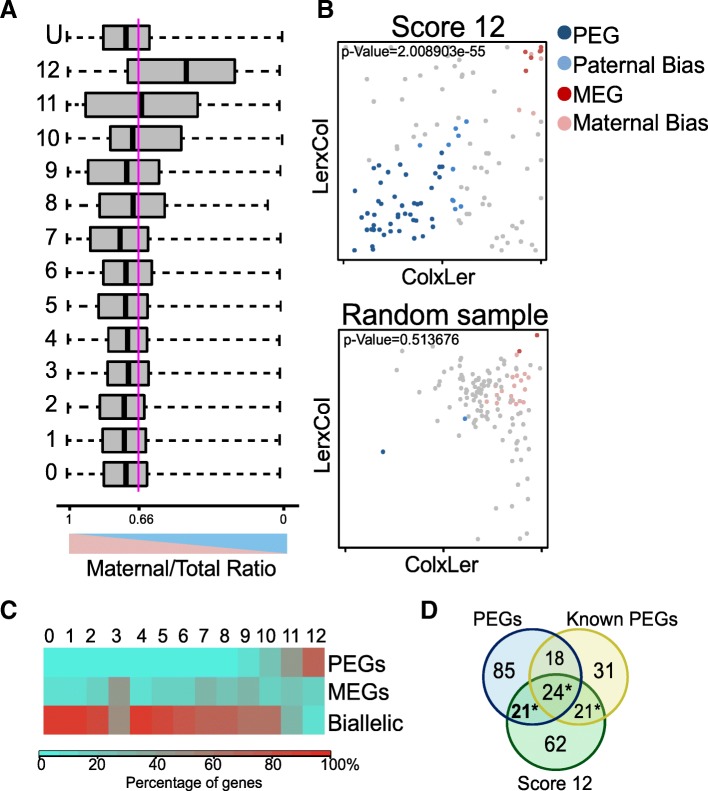
Fig. 6.
Confirmation of predicted PEGs in RNA samples of INTACT-purified endosperm nuclei. a Distribution of maternal to total read values for genes in each epigenetic category. The distribution for the total population of genes with informative reads (U) is included. Genes with the highest levels of CHG methylation, H3K27me3, and H3K9me2 show a clear trend towards paternally biased expression (around 0.5). Values correspond to combined values of Col × Ler and Ler × Col crosses. Boxes show medians and the interquartile range, lines show the full range of outliers. Blue line indicates the expected ratio for biallelically expressed genes (0.66). b Parent-of-origin distribution of the group of genes with score 12, compared with a random group of the same size. Significantly more PEGs are detected in the group of genes with score 12, compared with the random sample (hypergeometric test, P values correspond to the comparison with the total population of PEGs in the whole RNAseq data). The scatter plots show maternal to total read values for Col × Ler and Ler × Col reciprocal crosses. Colors indicate genes with significant parent-of-origin biased expressed: MEGs, 85% or more of maternal reads in each reciprocal cross; PEGs, 50% or more of paternal reads in each reciprocal cross. Maternally and paternally biased genes show significantly biased expression (P ≤ 0.01) in both reciprocal crosses. c Percentage of PEGs, MEGs, and biallelically expressed genes in each epigenetic category. Color code indicates the percentage of genes within each category. Categories with genes having lower levels of CHG methylation, H3K27me3, and H3K9me2 marks have significantly fewer PEGs than the highest scoring category (chi-square test, P < 1e−8 in categories 1–10; P = 0.001 in category 11). Only PEGs, MEGs, and biallelic categories were considered. d Overlap of PEGs that were detected in our INTACT-based RNAseq samples (blue) with genes predicted as PEGs based on their epigenetic score 12 (green) and previously reported PEGs (yellow) by [12, 14, 26, 27]. New predicted and confirmed PEGs in bold. Statistical significance was calculated using a hypergeometric test (P values < 4e−20)

