Fig. 5.
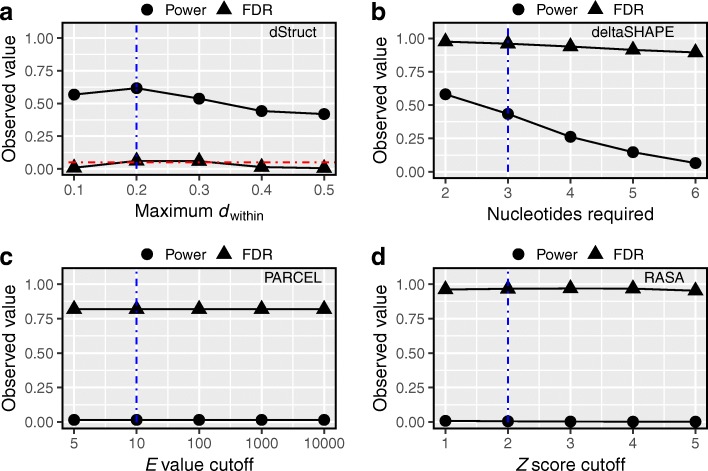
dStruct properly controlled the false discovery rates in simulated data. We searched for DRRs in simulated data using dStruct, deltaSHAPE, PARCEL, and RASA (a–d, respectively). The powers (circles) and FDRs (triangles) are plotted for each method. We tested each method for a range of stringency levels. Vertical dotted blue lines mark the default parameter settings. A horizontal dotted red line in a marks the specified target FDR. deltaSHAPE, PARCEL, and RASA do not control for FDR. X-axis labels indicate the parameter tuned for each method. a dStruct calls a candidate region a DRR only if it satisfies a quality threshold as well as has significant p value and q value. The quality threshold is specified in terms of a maximum allowed within-group variation, measured as the average dwithin in the region. b deltaSHAPE chains together differentially reactive nucleotides as DRRs if a minimum number of them are colocalized within a specified search length. c PARCEL quantifies the statistical significance of structural changes in a region in terms of an E value. Under the null hypothesis of no differential signal, it is computed as the number of regions that can be expected to have structural change scores at least as high as the given region’s score. d RASA identifies DRRs as the regions that have significant clustering of nucleotides with large changes in reactivities. The significance of the observed clustering is evaluated by comparing the observed distribution of the numbers of such nucleotides in sliding windows of a specified length with their null distribution obtained from permutations. The comparison is done in terms of standard Z scores

