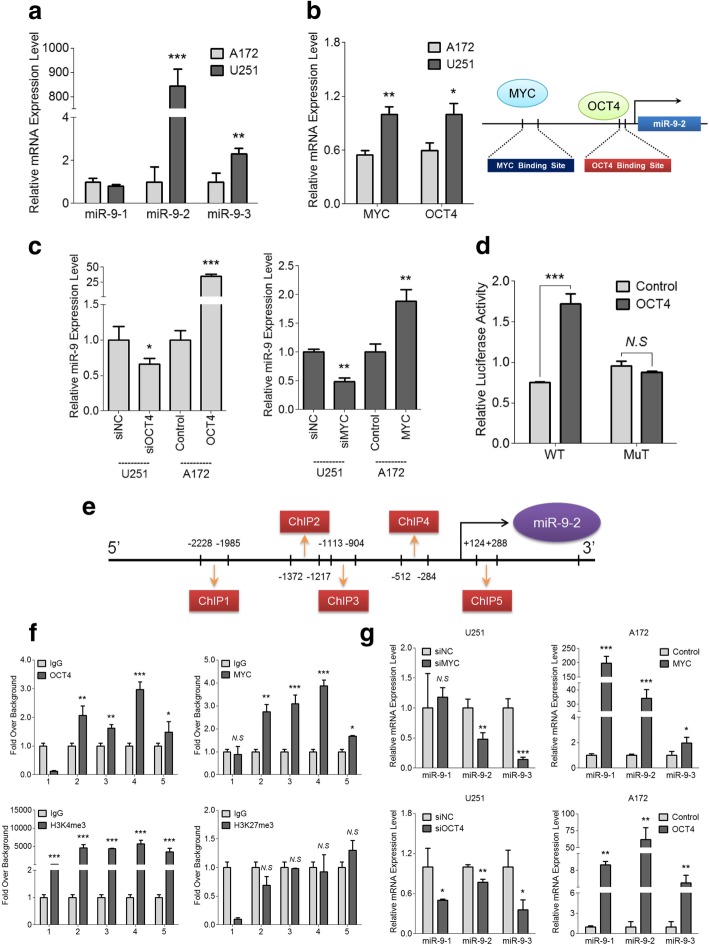
Fig. 6.
MiR-9 is directly activated by MYC and OCT4 in glioma cells. a Endogenous expression levels of the three miR-9 transcripts (miR-9-1, miR-9-2 and miR-9-3) were examined in A172 and U251 cells by qRT-PCR analysis. Data are shown as the mean ± s.d. (**P < 0.01 and ***P < 0.001; n = 3 independent experiments). b Endogenous expression levels of MYC and OCT4 were detected by qRT-PCR in A172 and U251 cells (left), and the model diagram exhibits the predicted MYC/OCT4 binding site on the miR-9-2 promoter region (right). Data are presented as the mean ± s.d. (*P < 0.05 and **P < 0.01; n = 3 independent experiments). c qRT-PCR analysis was applied to determine the miR-9 expression in A172 MYC/OCT4 and control cells and in U251 MYC/OCT4 siRNA and siNC cells. Error bars represent the s.d. (*P < 0.05, **P < 0.01 and ***P < 0.001; n = 3 independent experiments). d Dual-luciferase reporter assays were used to assess the relative luciferase activity of vectors with the wild-type or mutant OCT4 binding site upon co-transfection with an OCT4-expressing vector or control. Data are presented as the mean ± s.d. (N.S, no significance; ***P < 0.001; n = 3 independent experiments). e Diagram of the location and amplified fragments of the five ChIP primers on the promoter region of miR-9-2. f Enrichment of MYC, OCT4, H3K4me3 and H3K27me3 at the miR-9-2 promoter region was tested by ChIP assay in the U251 cells. Data are shown as the mean ± s.d. (N.S, no significance; *P < 0.05, **P < 0.01 and ***P < 0.001; n = 3 independent experiments). g Expression levels of the three miR-9 transcripts in the A172 MYC/OCT4 and control cells and in the U251 MYC/OCT4 siRNA and siNC cells. Error bars represent the s.d. (N.S, no significance; *P < 0.05, **P < 0.01 and ***P < 0.001; n = 3 independent experiments)

