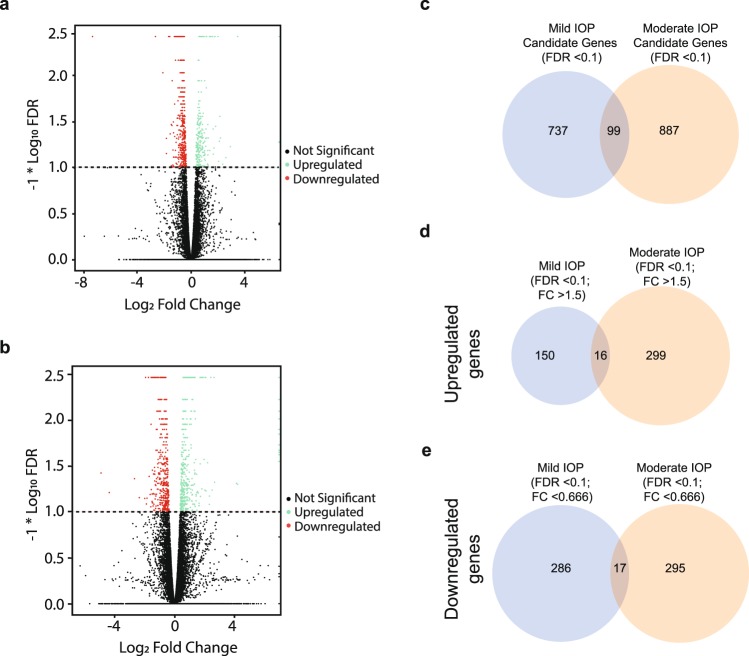
Figure 3.
Differentially Expressed Genes Following Mild and Moderate IOP Elevation. (a,b) Volcano plots of significantly (FDR < 0.1) differently expressed genes (DEGs) for both Mild (a) and Moderate (b) IOP levels (above dotted line). Upregulated DEGs (Log2 fold change of ≥0.5849 or ≥1.5-fold change) and downregulated DEGs (Log2 fold change of ≤−0.5849 or ≤0.666-fold change), are indicated in green and red, respectively. Genes with Log2 Fold change of <|0.5849| are not significant (black). (c) Venn Diagram depicting the overlap of significant (FDR < 0.1) candidate DEGs in the Mild and Moderate IOP groups (does not include fold-change criteria). (d,e) Venn Diagrams of overlapping significantly (FDR < 0.1 and Log2 fold change of ≥|0.5849|) identified for up- (d) and down- (e) regulated DEGs.

