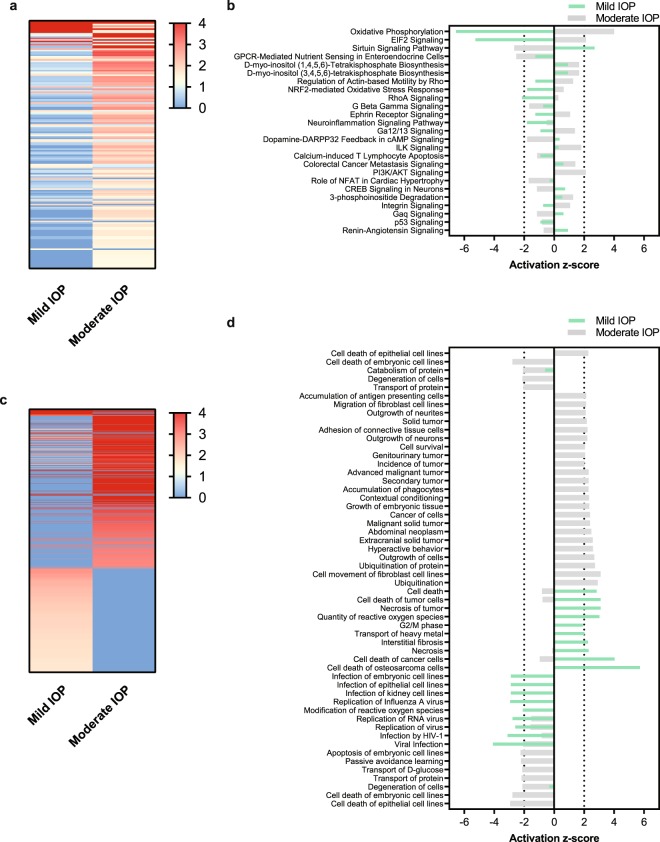
Figure 4.
Pathway Analysis Following Mild and Moderate IOP. Ingenuity Pathway Analysis of Mild and Moderate IOP compared to Control. (a,c) Heatmap of the significant changes to the canonical pathway (a) and disease/bio functions (c) filtered by −log (P-value). (b,d) Activation z-score directionality graph of the top significant (−log (P-value) > 1.3) canonical pathways (b) and disease/bio functions (d) for both Mild and Moderate IOP elevation. Canonical pathways and disease/bio functions with a Z-score ≥ |2| are significant, were a positive value is considered to be activated and a negative value is considered to be inactivated.

