Figure 2.
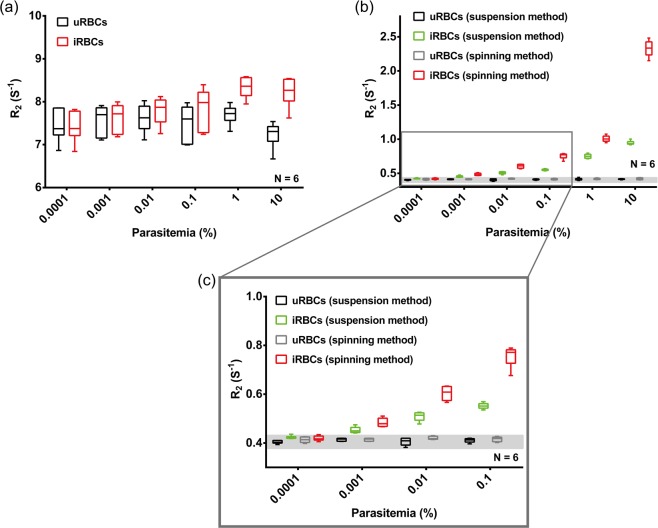
(a) R2 measurements of unlysed iRBCs spiked to 100 µl of uRBCs to make parasitemia of 10 to 0.0001% (red) and corresponding uRBCs (black) in which blood samples from different healthy blood donors were used. The R2 measurements of same set of RBC samples (uRBCs and iRBCs with parasitemia ranging from 10% to 0.0001%) after saponin lysis are shown in (b) R2 measurements of samples prepared by spinning method (red) and R2 measurements of samples prepared by suspension method (green). (c) is the enlarged version of (b) at low parasitemia region.

