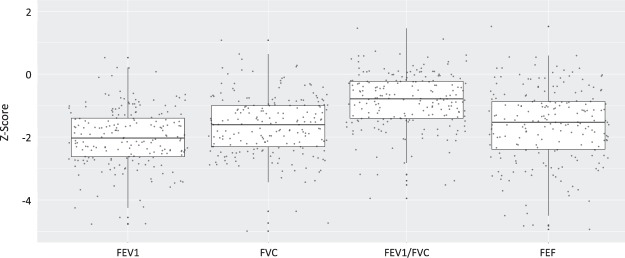
Figure 1.
Distribution of spirometry variable Global Lung Function Initiative (GLI) z-scores. The X-axis displays the spirometry variables and the Y-axis demonstrates the z-score values. The box portion of the boxplot represents the 25th and 75th percentile with the solid mid-line representing the median and the whisker portion representing the 2.5th to the 97.5th percentile. Each dot represents a participant measurement. Median z-score values were well below zero [FEV1 = −2.05 (IQR −2.64, −1.41); FVC = −1.61 (IQR −2.30, −0.99); FEV1/FVC = −0.78 (IQR −1.40, −0.23); FEF25–75 = −1.53 (IQR −2.41, −0.86)]. Notably the median value for FEV1 z-score was less than −1.64, the GLI-defined lower limit of normal, and FVC and FEF25–75 approached this value.

