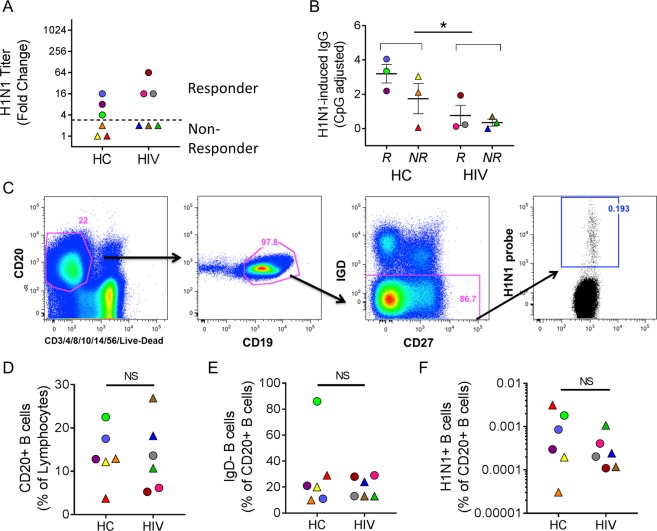
Figure 1.
Serologic and phenotypic characterization of ex vivo B cells after influenza vaccination. (A) Fold change (3 wks post-vaccination/baseline) H1N1 HAI titer for each individual. The dotted line shows the threshold for discriminating between responders and non-responders. (B) B cell Elispot data from 3 wks post-vaccination showing IgG production in response to H1N1 stimulation for 5 days. *denotes p < 0.05 after t test comparing HC and HIV groups. (C) Gating scheme for isolating H1N1-specific B cells. Frequency of (D) CD20+ B cells, (E) IgD- B cells, and (F) H1N1-specific B cells in study participants.

