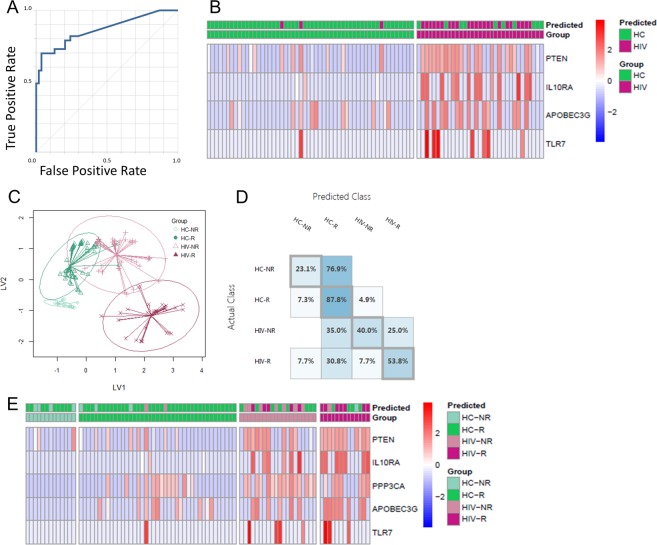
Figure 5.
Predictive modeling of H1N1-specific B cells. For classification of HIV vs HC, (A) Receiver operating characteristic (ROC) curve for two-class neural network showing prediction accuracy of 0.864. Single cell gene expression data for 33 genes was split 2:1 for train: test. (B) Z score heat map (scaled by gene) showing ‘test’ set of single cells with prediction and actual grouping based on 4-gene signature. For classification of Vaccine Responder and Non-Responder for HIV and HC: (C) Graphical representation of LASSO-PLSDA model using 5-gene signature to segregate 4 groups: HC R, HC NR, HIV R, HIV NR. (D) Classification matrix for the 4 groups showing performance of the model by prediction accuracy for each group. (E) Z score heat map (scaled by gene) showing ‘test’ set of single cells with prediction and actual grouping based on 4-gene signature.

