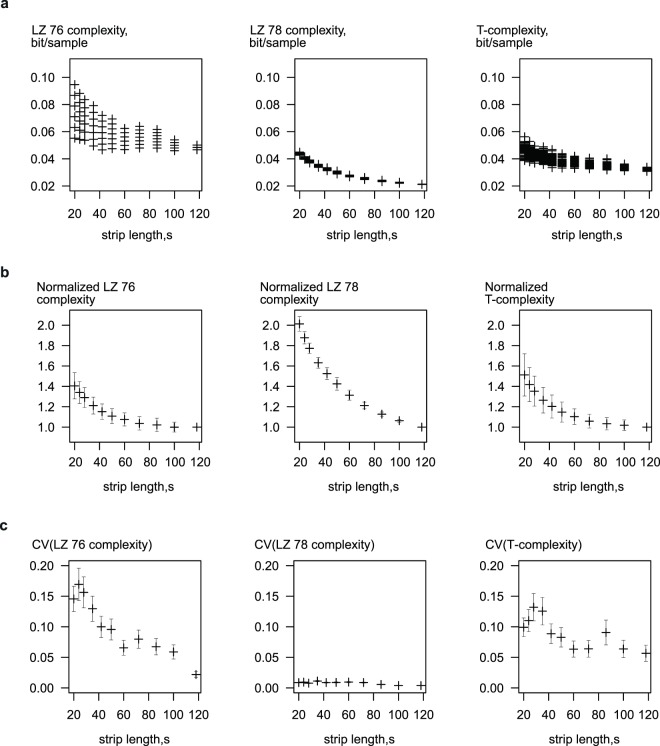
Figure 1.
Effect of signal length on the complexity values returned by different estimators. (a) Distribution of complexity values obtained by analysis of different length samples extracted from a 120-sec fragment of telemetric equine ECG recording. Sixty random samples from each of the 15 horses analysed for each strip length. (b) Dependence of complexity values normalized to complexity at the maximal strip length (n = 15). (c) Effect of sample length on the coefficient of variation of different complexity values (n = 15).

