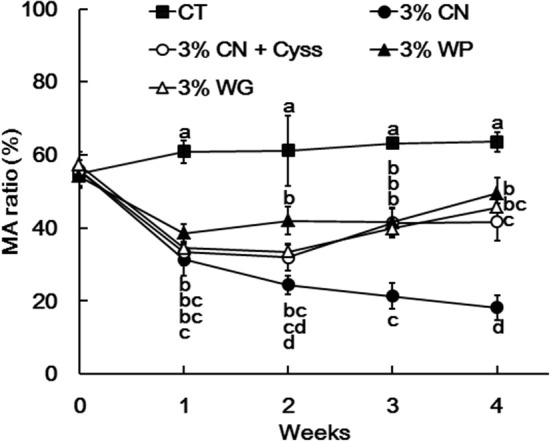
Figure 3.

Ratio of mercaptalbumin among total plasma albumin in Experiment 1. Plasma samples, obtained weekly, were subjected to HPLC to determine albumin redox state. Ratios of mercaptalbumin (MA) among total albumin are shown as means ± SD (n = 6); values with different letters are significantly different at each time point (P < 0.05). CN, CT, Cyss, WG, and WP denote casein, control, cystine, wheat gluten, and whey protein, respectively.
