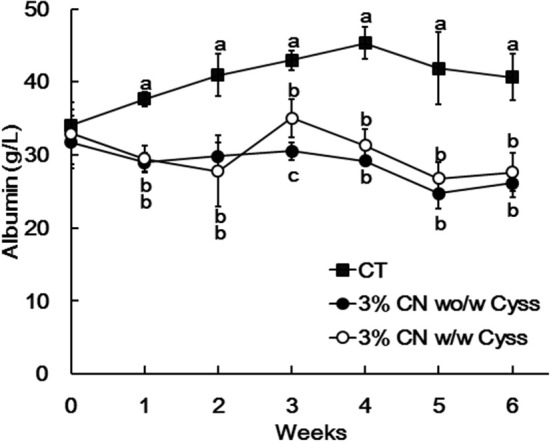
Figure 5.

Plasma albumin levels in Experiment 2. The levels of albumin were measured for plasma samples obtained during the experimental period. Data are shown as means ± SD (n = 6); values with different letters are significantly different at each time point (P < 0.05). CN, CT, and Cyss denote casein, control, and cystine, respectively.
