. 2018 Dec 13;10(7):1953–1961. doi: 10.1039/c8sc04875d

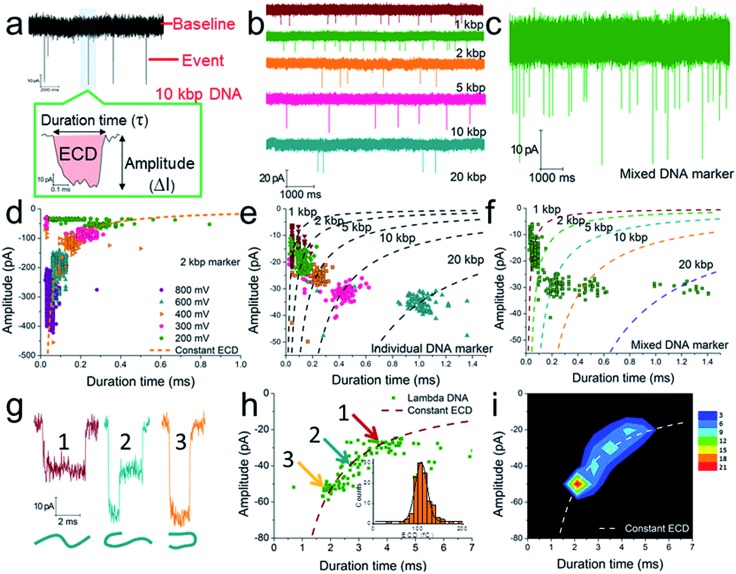
Fig. 2. The verification of quantitative measurements of dsDNA species using a naked conical glass nanopore (CGN). (a) The current trace of a 10 kbp dsDNA marker at 300 mV. The event in the coloured area is shown with greater time resolution and with the event charge deficit (ECD) marked in red (the integrated area of the event relative to the baseline). The current trace of an individual DNA marker (b) and a mixed DNA marker (c) at 200 mV. (d) A scatter plot of amplitude vs. duration time for 2 kbp dsDNA marker translocation through a CGN at different voltages. (e) A scatter plot of individual dsDNA markers ranging from 1 to 20 kbp. (f) A scatter plot of mixed dsDNA markers ranging from 1 to 20 kbp (the dashed lines show the dsDNA markers fitted according to the constant ECD method, ref. 62). Note: the experiments in (e) and (f) were performed with the same pore. (g) Three characteristic current signals of lambda DNA translocation. (h and i) A scatter plot (h) and event density plot (i) showing the amplitude and duration time for lambda DNA. The inset of (h) shows a histogram of the calculated ECD values for lambda DNA. All experiments were carried out at 200 mV unless otherwise indicated. The numbers of events in each scatter plot and histogram are shown in Table S2. .

Fig. 2