. 2018 Dec 21;10(7):1936–1944. doi: 10.1039/c8sc04747b

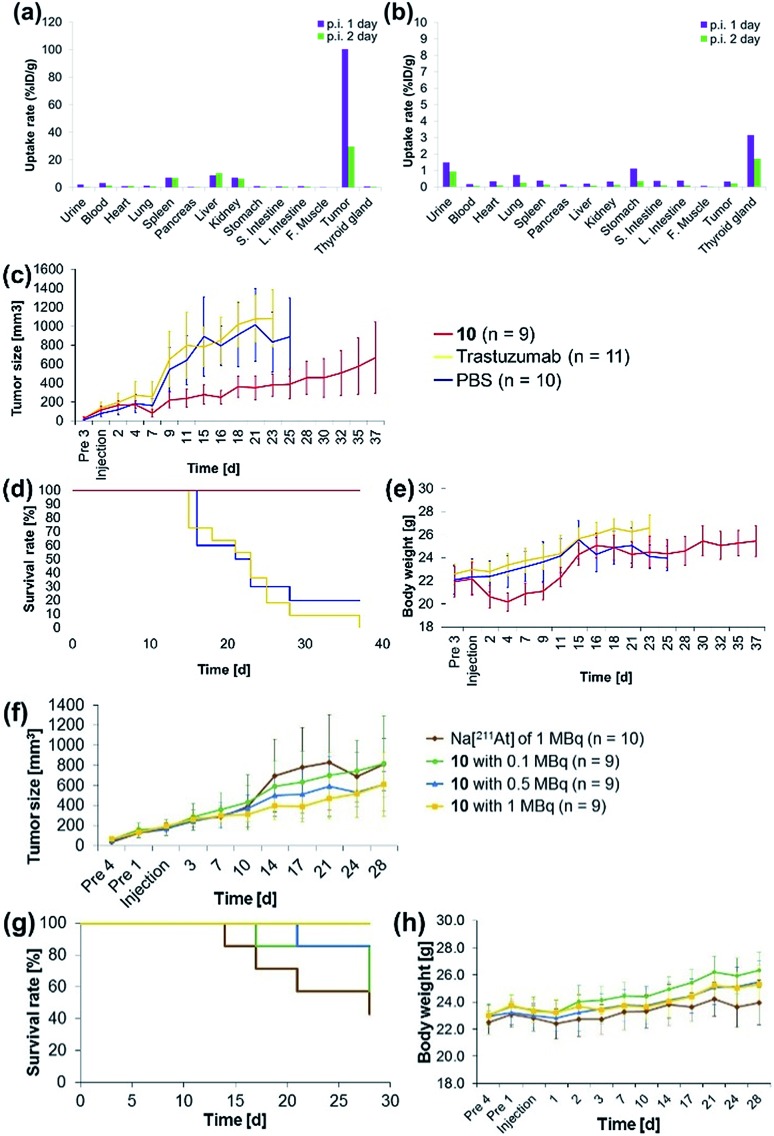
Fig. 3. Concentrations of (a) the 211At-labeled trastuzumab 10 or (b) a 0.05% PBS-T solution of Na[211At] in each organ of the A431 cells xenograft mouse. (a) 6.3 μg 10 labeled with 211At (1.4 MBq) in 5 μL 0.05% PBS-T or (b) 211At (1.0 MBq) in 5 μL PBS were administered to the A431 xenograft mouse by intratumor injection. The radioactivity of each organ was measured after dissection 1 day (purple bar) or 2 days (green bar) post-injection. Therapeutic efficacies of the α-emitting 10 (red line), trastuzumab (non-labeled, yellow line), or PBS (blue line) after intratumor injection: (c) tumor size, (d) survival curve, and (e) body weight of the xenograft mice after intratumor injection. Dose dependence of the α-emitting therapeutic efficacy of 211At after intratumor injection of Na[211At] (brown line), 10 with 0.1 MBq (green line), 0.5 MBq (blue line), and 1 MBq (yellow line). (f) Time course analysis of the tumor size. (g) Survival curves of the tumor-bearing mice. (h) Body weight of the tumor-bearing mice after intratumor injection. The tumor size was measured in tumor xenograft mice with tumor sizes exceeding a volume (V) of 1200 mm3, calculated using the formula V = Rr2/2. Here, R and r indicate the long and short axes of the tumor in the xenograft mouse, respectively.

Fig. 3