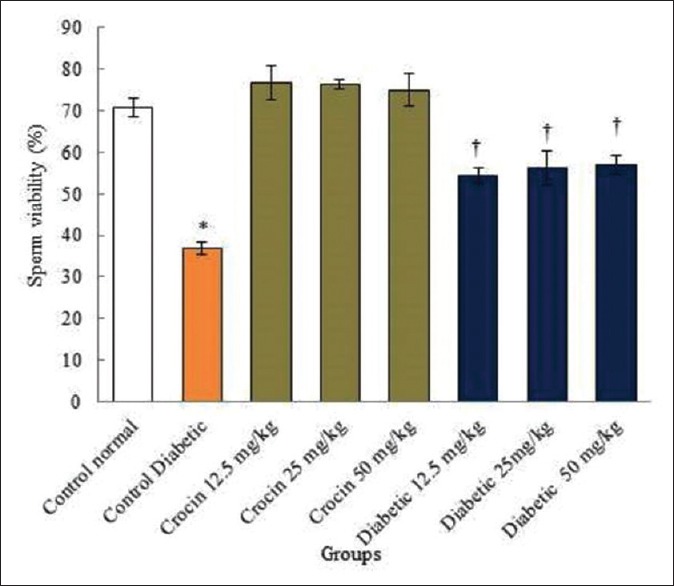
Figure 3.

The correlation analysis between control diabetic, normal, and diabetic groups in rats and sperm viability. *Significant decrease in the diabetic control group compared to the normal control group (P < 0.05). †Significant increase in all diabetic groups compared to the diabetic control group (P < 0.05)
