
Figure 2.
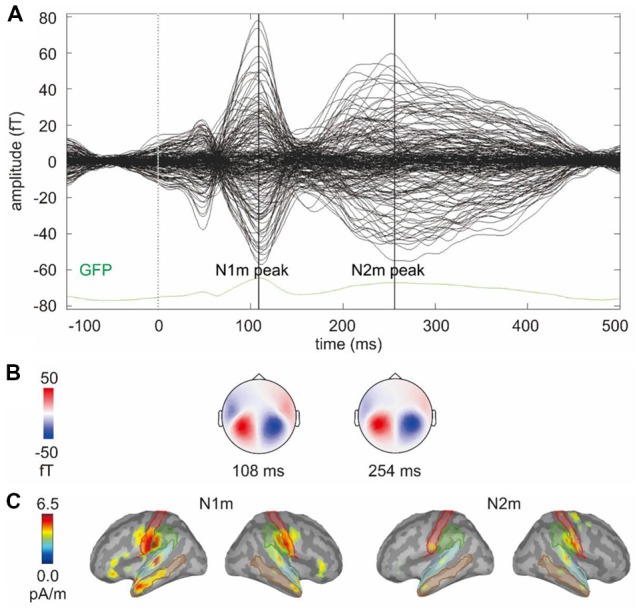
(A) Butterfly plot of the grand average signals of the gradiometers and the grand average global field power (GFP) of the gradiometers (across 14 participants and 32 conditions). The vertical lines mark the N1m and N2m peaks. (B) The topographies for the magnetometers at N1m and N2m peaks showing the magnetic field distribution. (C) Grand average source activity (across 14 participants and 32 conditions) at the N1m and N2m peak. The colored lines mark the outlines of the five brain regions selected to represent the auditory response.