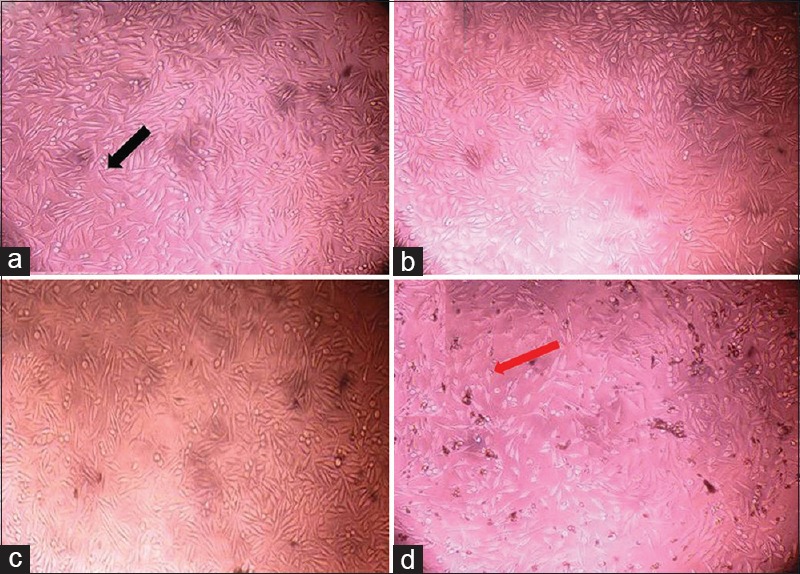
Figure 2.

(a) Group A – control, (b) Group B – platelet-rich fibrin, (c) Group C – platelet-rich fibrin + nanohydroxyapatite, (d) Group D – platelet-rich fibrin + dentin chips. Black arrow indicates the cells with normal fibroblastic/spindle-shaped morphology and red arrow indicates the cells with lost morphology, indicates the cytotoxicity
