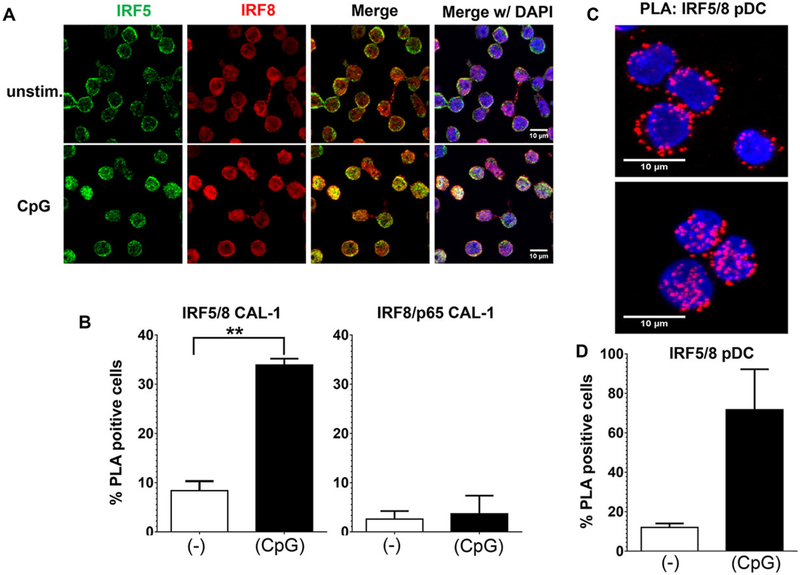
Figure 6.
Colocalization of IRF5 with IRF8 following CpG-stimulation of human pDCs. (A) CAL-1 cells were stimulated for 60 min with 1 μM of CpG ODNs. The cells were then fixed, permeabilized, and stained with antibodies to detect IRF5 (green) and IRF8 (red). Nuclei were stained with DAPI (blue). One representative image from three independent experiments is shown. (B) A proximity ligation assay was performed on the cells described in (A) using Abs against IRF5 and IRF8 (or p65 and IRF8 as a negative control). The percentage of cells with significant nuclear PLA signals, averaged from three independent experiments (mean + SD) is shown. **p < 0.01, Student’s t-test. (C) Primary pDCs from healthy volunteers were stimulated for 60 min with CpG ODN and analyzed by PLA as described in (B). PLA signals appear as red dots. One representative image from two independent experiments is shown. (D) The percentage of cells with significant nuclear PLA signals, from two independent experiments (mean + SD), was determined using ImageJ software.

