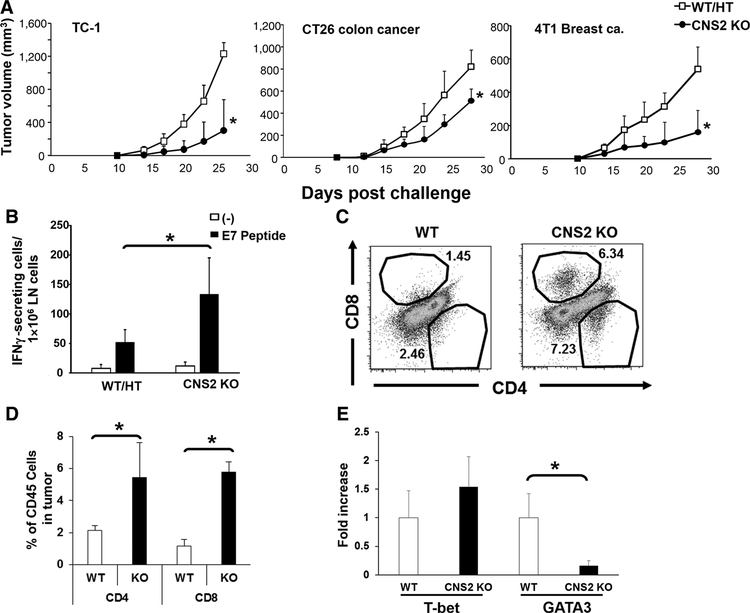
Figure 5.
Tumor growth and tumor-infiltrating T cells in CNS2 KO mice. A, 105 TC-1, CT26, or 4T1 cancer cells were injected subcutaneously into WT/CNS2 HT or CNS2 KO mice. Data represent the combined means + SD of 10–16 mice/group from two to three independent experiments. *, P < 0.01 when compared with WT/HT mice. B, 105 TC-1 cells were injected subcutaneously into WT/CNS2 HT or CNS2 KO mice. Tumor draining lymph nodes (LN) were removed on day 21 and the cells stimulated in vitro with 0.1 μg of E7 peptide. Results show the number of IFNγ-producing cells quantified by ELISPOT. Results were evaluated independently in each mouse, and data represent the mean + SD of 5 mice per group. *, P < 0.05. C and D, CT26 tumors were removed at day 21 and the number of tumor-infiltrating CD45+ cells that expressed CD4 and CD8 determined by FACS. C, Representative results from one mouse per group and (D) mean + SD from 5 independently analyzed mice per group, showing CD4- and CD8-expressing cells as a percentage of all tumor-infiltrating CD45+ lymphocytes. E, CD4 or CD8 T cells were sorted by FACS and analyzed for T-bet and GATA3 mRNA expression. Results represent the mean + SD of results from four independent sorted cell populations; *, P < 0.05.

