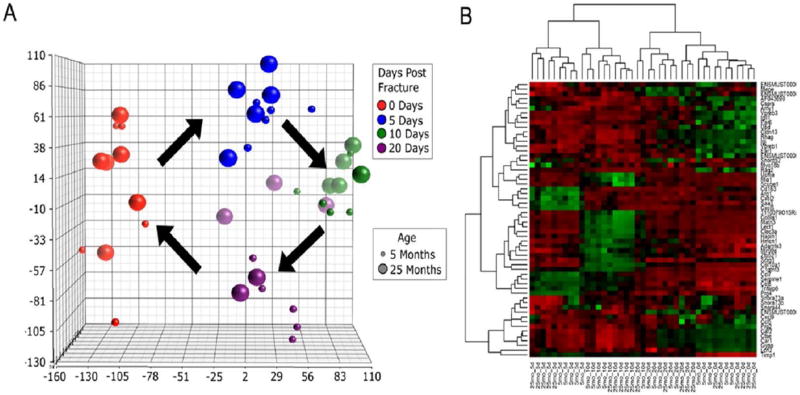
Fig. 1. Principle component and hierarchical clustering analysis of gene expression.
(A) Principal component analysis indicates a cyclical progression of gene expression during fracture healing. As time progresses, differential gene expression is greatest at 10 days and moves closer to baseline by 20 days. Gene expression profiles clustered primarily on the basis of DPF, then by age. (B) Hierarchal clustering analysis of top 5 most differentially expressed genes at each DPF. Gene expression clustered initially on days post fracture and secondarily on animal age. Red indicates higher level of expression, whereas green indicates lower level of expression.

