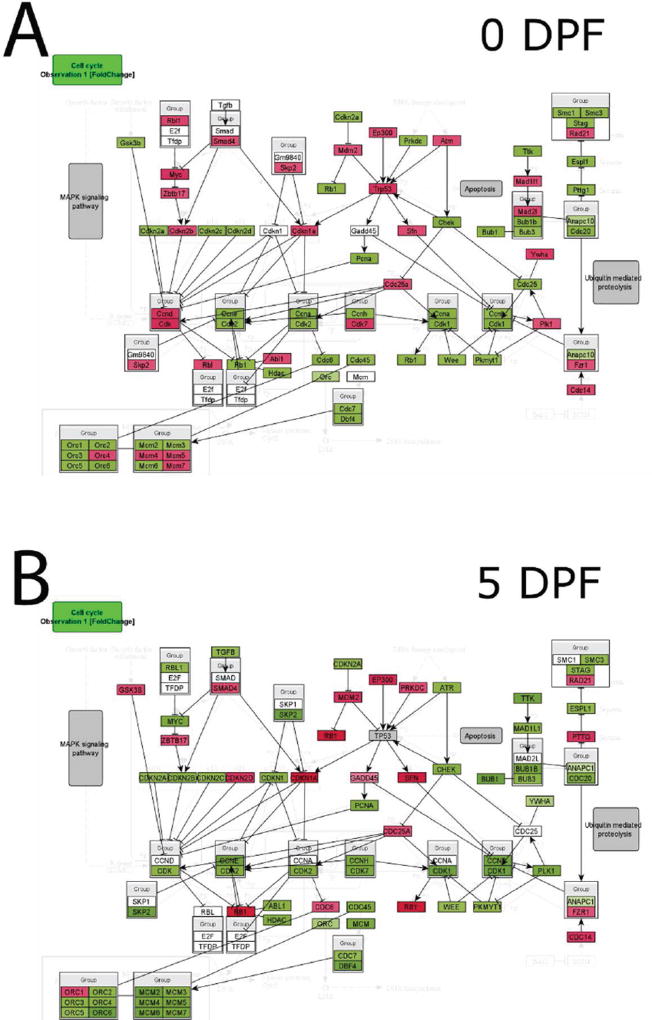
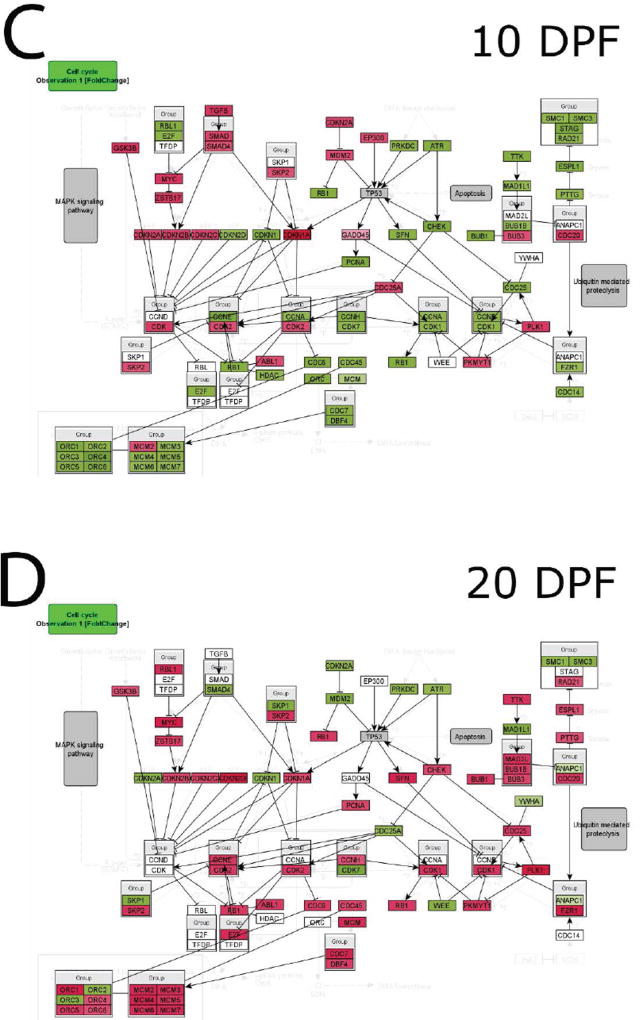
Fig. 4. Cell cycle marker gene expression analysis.
InCroMap was used to visualize cell cycle regulatory genes comparing expression in old and young adult mice at (A) 0, (B) 5, (C) 10, and (D) 20DPF. Green represents higher expression in young adult mice, whereas red indicates higher expression in old mice. At 0, 5, and 10 DPF, young adult mice demonstrated higher expression of cell cycle progression genes. Old mice showed higher expression of cell cycle progression genes at 20 DPF.


