Figure 1.
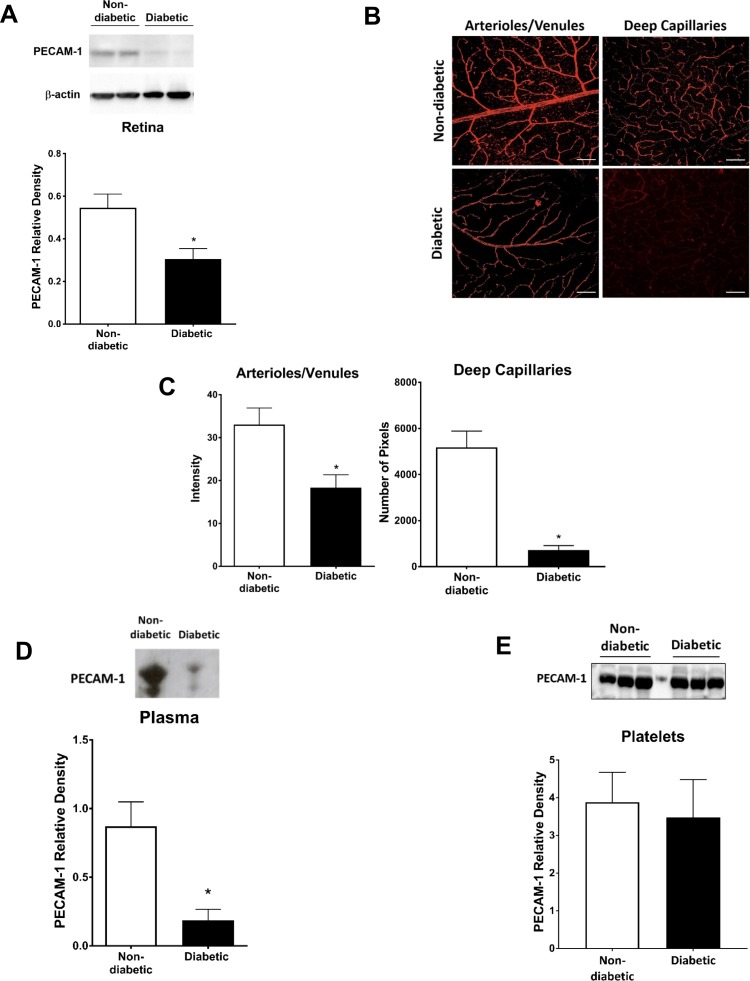
PECAM-1 was significantly decreased in the retina of diabetic rats. The decrease in PECAM-1 was determined via western blotting of retinal tissue (A) and immunostaining of retinal flatmounts (B); scale bar: = 100 μm. Immunostaining intensity is shown in the superficial retina and the number of pixels exceeding background levels in the capillary layer (C). PECAM-1 mean band densities were significantly reduced in the diabetic plasma (D), but not on the diabetic platelets (E). Western blotting data is a comparison of the relative PECAM-1/β-actin (retina) or PECAM-1/total protein (plasma, platelets) band densities. *P < 0.05, N = 5 to 9 per group.

