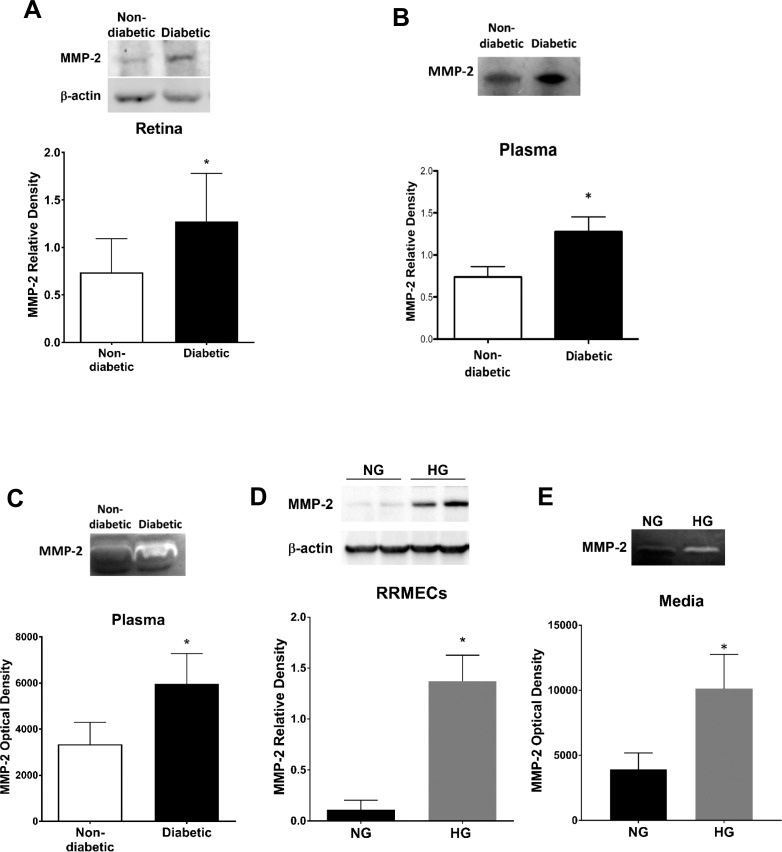
Figure 6.
MMP-2 levels are significantly increased under hyperglycemic conditions. Western blot analyses of MMP-2 in (A) rat retina and (B) rat plasma. (C) MMP-2 activity (zymography) in rat plasma. (D) MMP-2 western blots from RRMECs grown under NG or HG conditions. (E) MMP-2 supernatant activity in NG or HG RRMECs. Western blotting data is a comparison of the relative MMP-2/β-actin (retina, RRMECs) band densities or MMP-2/total protein (plasma). *P < 0.05 versus NG; N = 5 to 8 per group in vivo and N = 3 per group in vitro.

