. 2018 Dec 27;10(8):2360–2372. doi: 10.1039/c8sc04811h

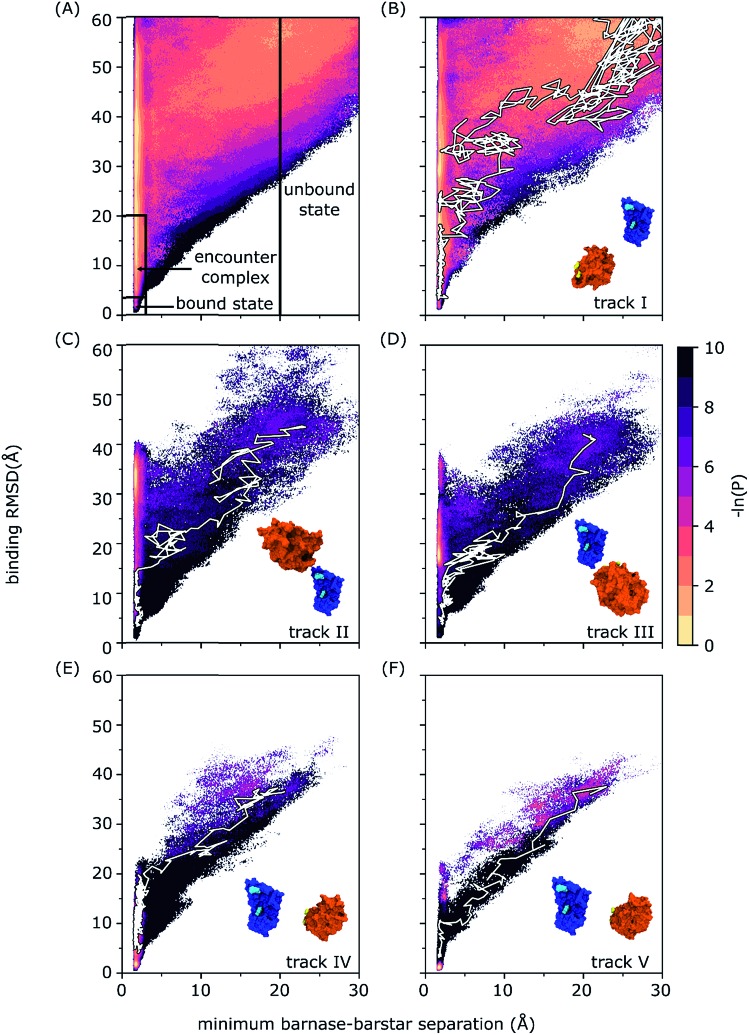
Fig. 1. Probability distributions as a function of the WE progress coordinate for (A) all simulation data with definitions of the unbound state, encounter complex, and bound state delineated by solid black lines and (B–E) tracks I–V. In each of the panels B–E, a snapshot of the initial unbound-state conformation is included with molecular surface representations of barnase and barstar in blue and orange, respectively, barnase anchor residues (K27 and R59) are highlighted in cyan, and barstar anchor residues (D35 and D39) are highlighted in yellow; a representative binding pathway along the corresponding probability distribution is highlighted in white. The probability distribution of each binding track was normalized according to the total probability of that track. The color scale represents –ln P where P is the probability density calculated as the sum of appropriate trajectory weights.

Fig. 1