. 2018 Dec 27;10(8):2360–2372. doi: 10.1039/c8sc04811h

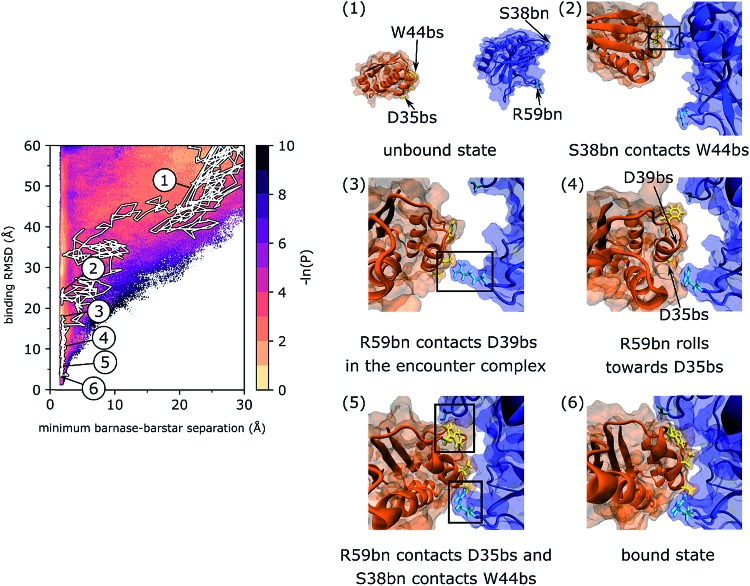
Fig. 2. A representative, continuous binding pathway of the most probable track (track I). On the left, the pathway is highlighted in white along the probability distribution of the WE progress coordinate. The simulation was initiated from (1) an unbound state in which barnase (blue) and barstar (orange) were separated by 20 Å and their binding interfaces were pointing away from each other. Binding interface residues of barnase, S38bn and R59bn, are shown in cyan. Binding interface residues of barstar, D35bs and D39bs, are shown in yellow. Diffusional collision of the binding partners initially formed transient W44bs-S38bn contacts (2), which then dissociated upon forming D39bs-R59bn contacts in the encounter complex state (3). Eventually, R59bn rolled along the molecular surface of barstar to form contacts with D35bn while reforming W44bs-S38bn contacts (5). The formation of these contacts at opposite edges of the binding interfaces facilitated rearrangement of the encounter complex to the native, bound state (6). This binding pathway is also illustrated by Movie S1 in the ESI. .

Fig. 2