. 2018 Dec 27;10(8):2360–2372. doi: 10.1039/c8sc04811h

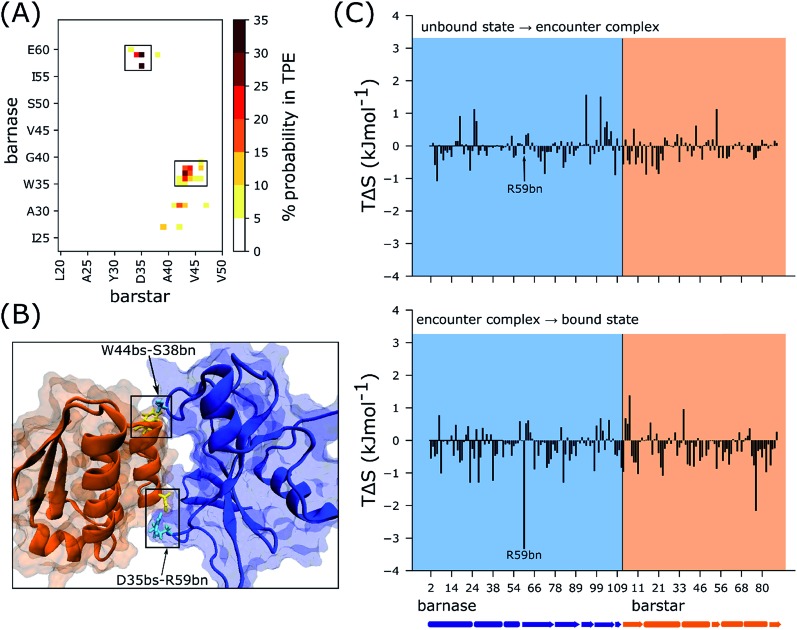
Fig. 3. (A) Map of pairwise residue contacts formed in the encounter complex ensemble. The color bar represents the percent probability of forming a given pair of residue contacts in the transition path ensemble (TPE). (B) Locations of the most kinetically important residue contacts indicated in the crystal structure of the native complex of barnase (blue) and barstar (orange) with R59bn and S38bn in cyan and D35bs and W44bs in yellow. (C) TΔS per residue where ΔS is the change in sidechain conformational entropy of the residue upon forming the encounter complex (top) and upon rearrangement of the encounter complex to the bound state (bottom). Barnase and barstar residues are indicated by the blue and orange shaded regions, respectively. Secondary structure elements are indicated below the x-axis. As highlighted, R59bn is the residue with the largest TΔS upon rearrangement of the encounter complex to the bound state. Each histogram shown here was generated using 25 bins (see Methods).

Fig. 3