. 2018 Dec 27;10(8):2360–2372. doi: 10.1039/c8sc04811h

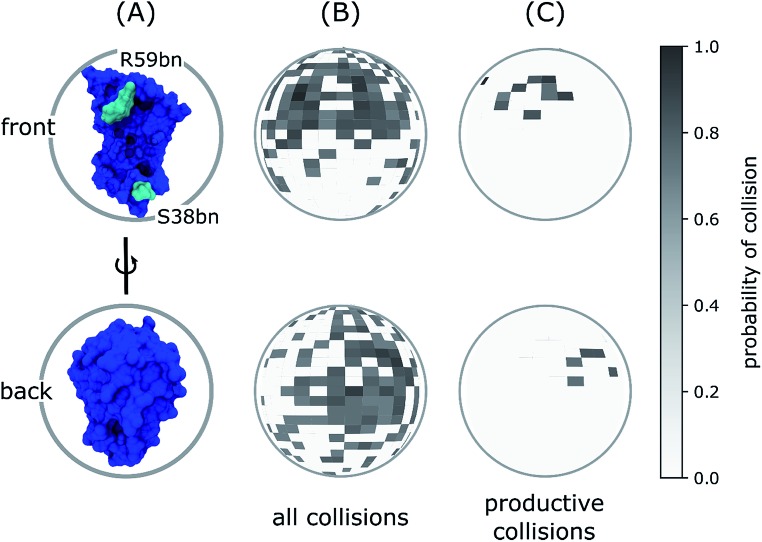
Fig. 4. Spherical maps of ligand entry point distributions for the barstar ligand in diffusional collisions with the barnase receptor. (A) Reference orientations of barnase (blue) for ligand entry point distributions in panels B and C where each probability distribution is projected onto a unit sphere centered on barnase in one of two orientations: the front view corresponding to a “head-on” view of the barnase binding interface and the back view corresponding to a 180° rotation around the vertical axis of the front view. (B) Ligand entry point distributions for all diffusional collisions. (C) Ligand entry point distributions for only productive collisions that form encounter complexes, which subsequently rearrange to the bound state. As shown in panel C, the most probable entry points are in the vicinity of R59bn (cyan in panel A), which lies at one edge of the barnase binding interface, as opposed to S38bn, which lies at the other edge.

Fig. 4